Customized network monitoring dashboards
Create your own Custom Network Monitoring Dashboards with Domotz. We’ve got powerful network monitoring dashboards that you can tailor to your needs.
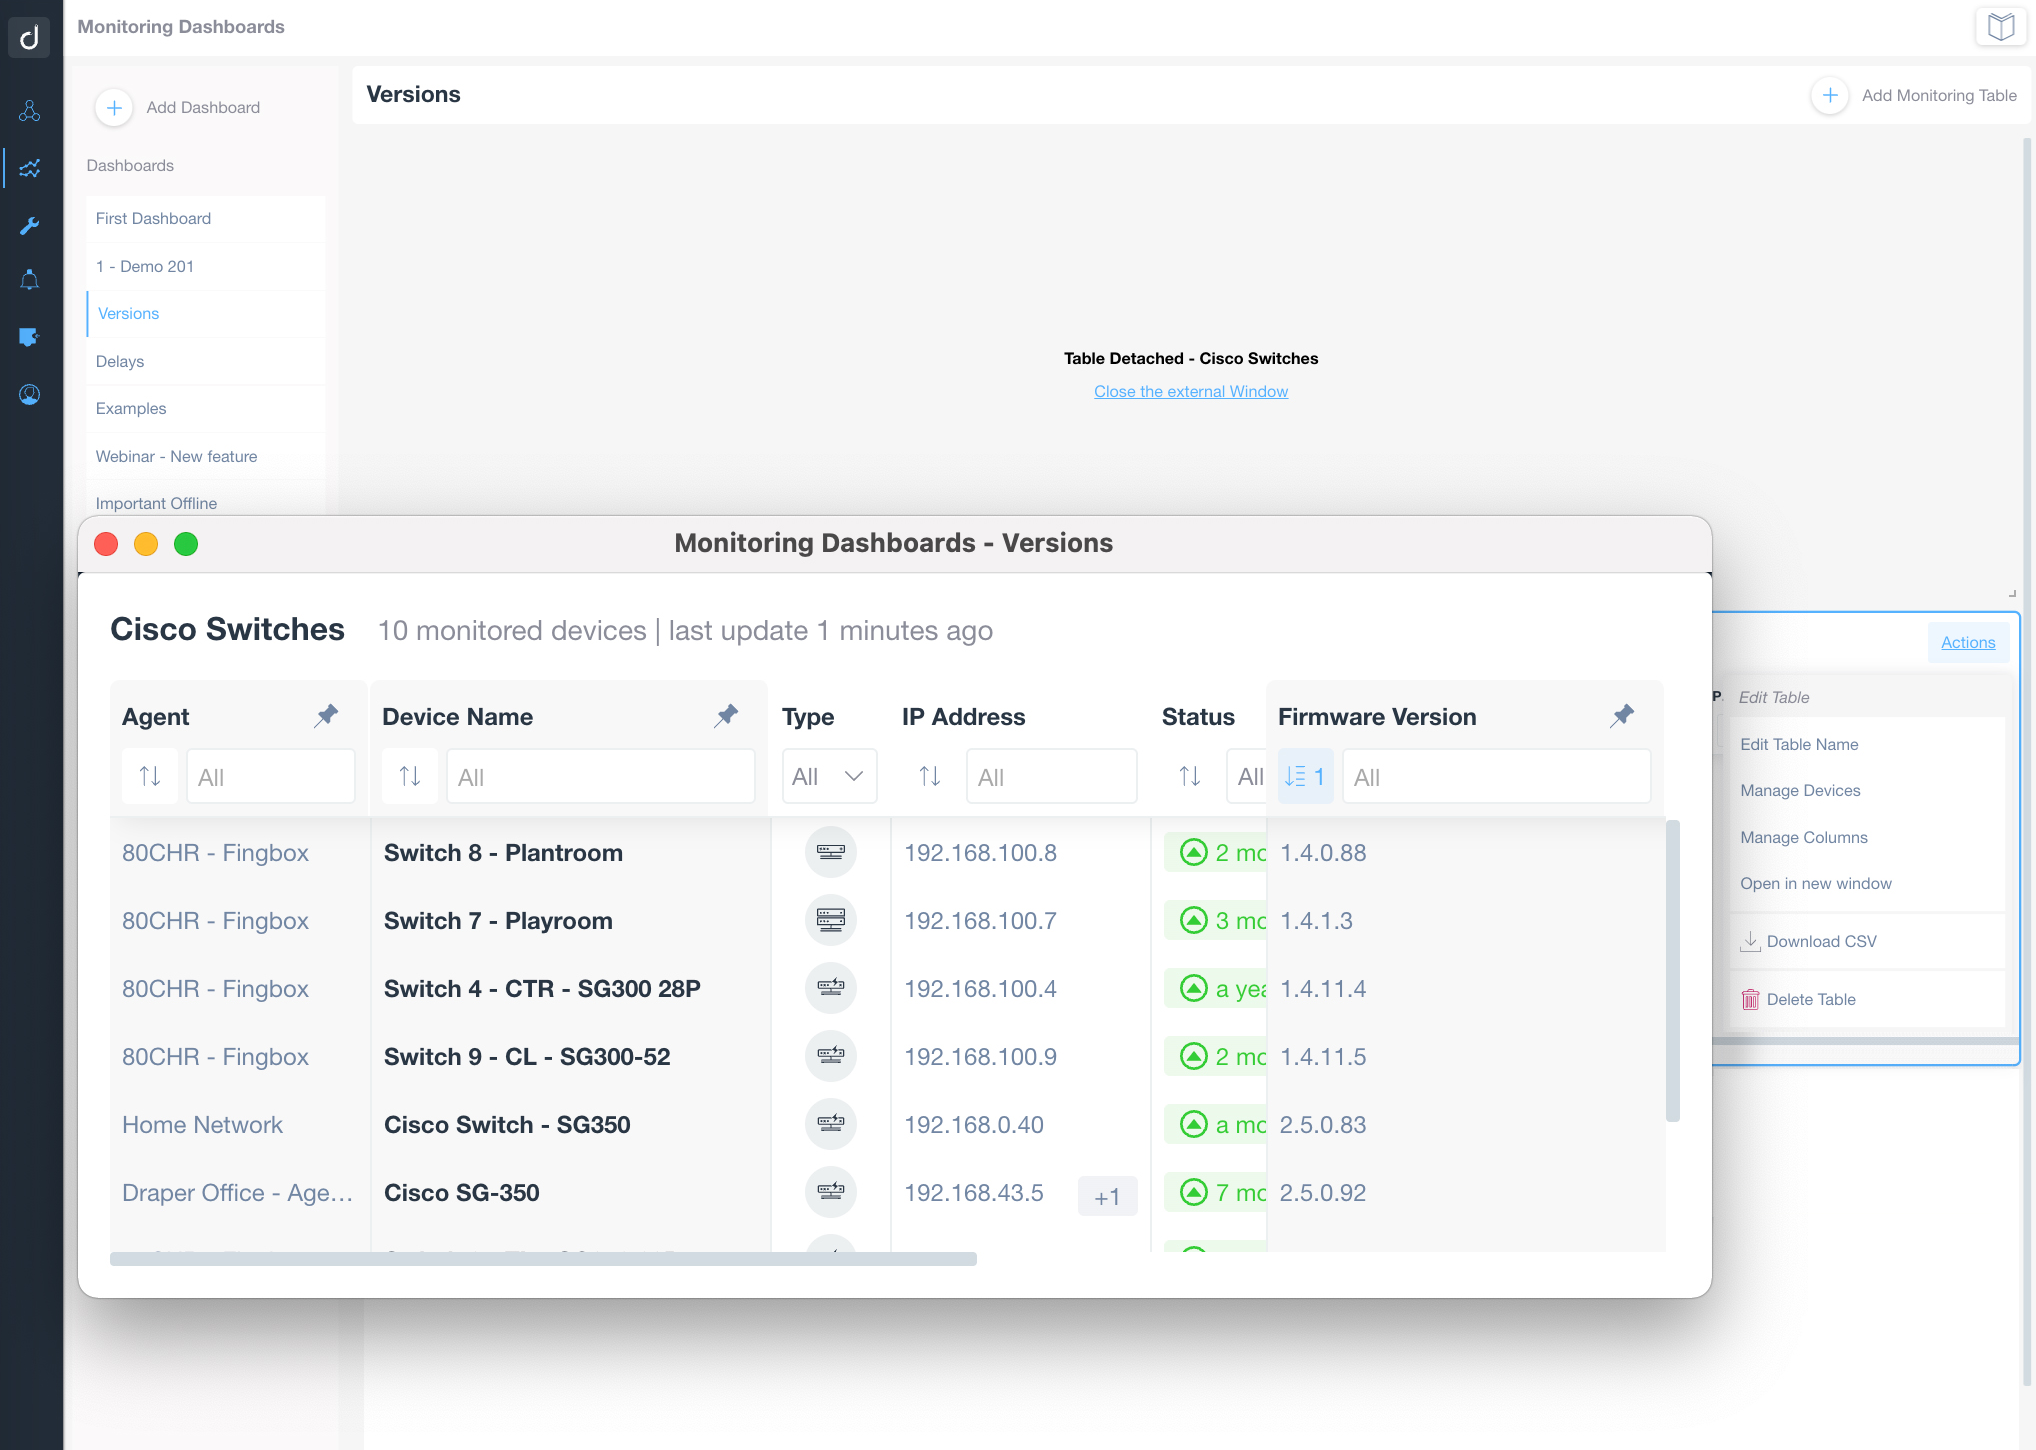
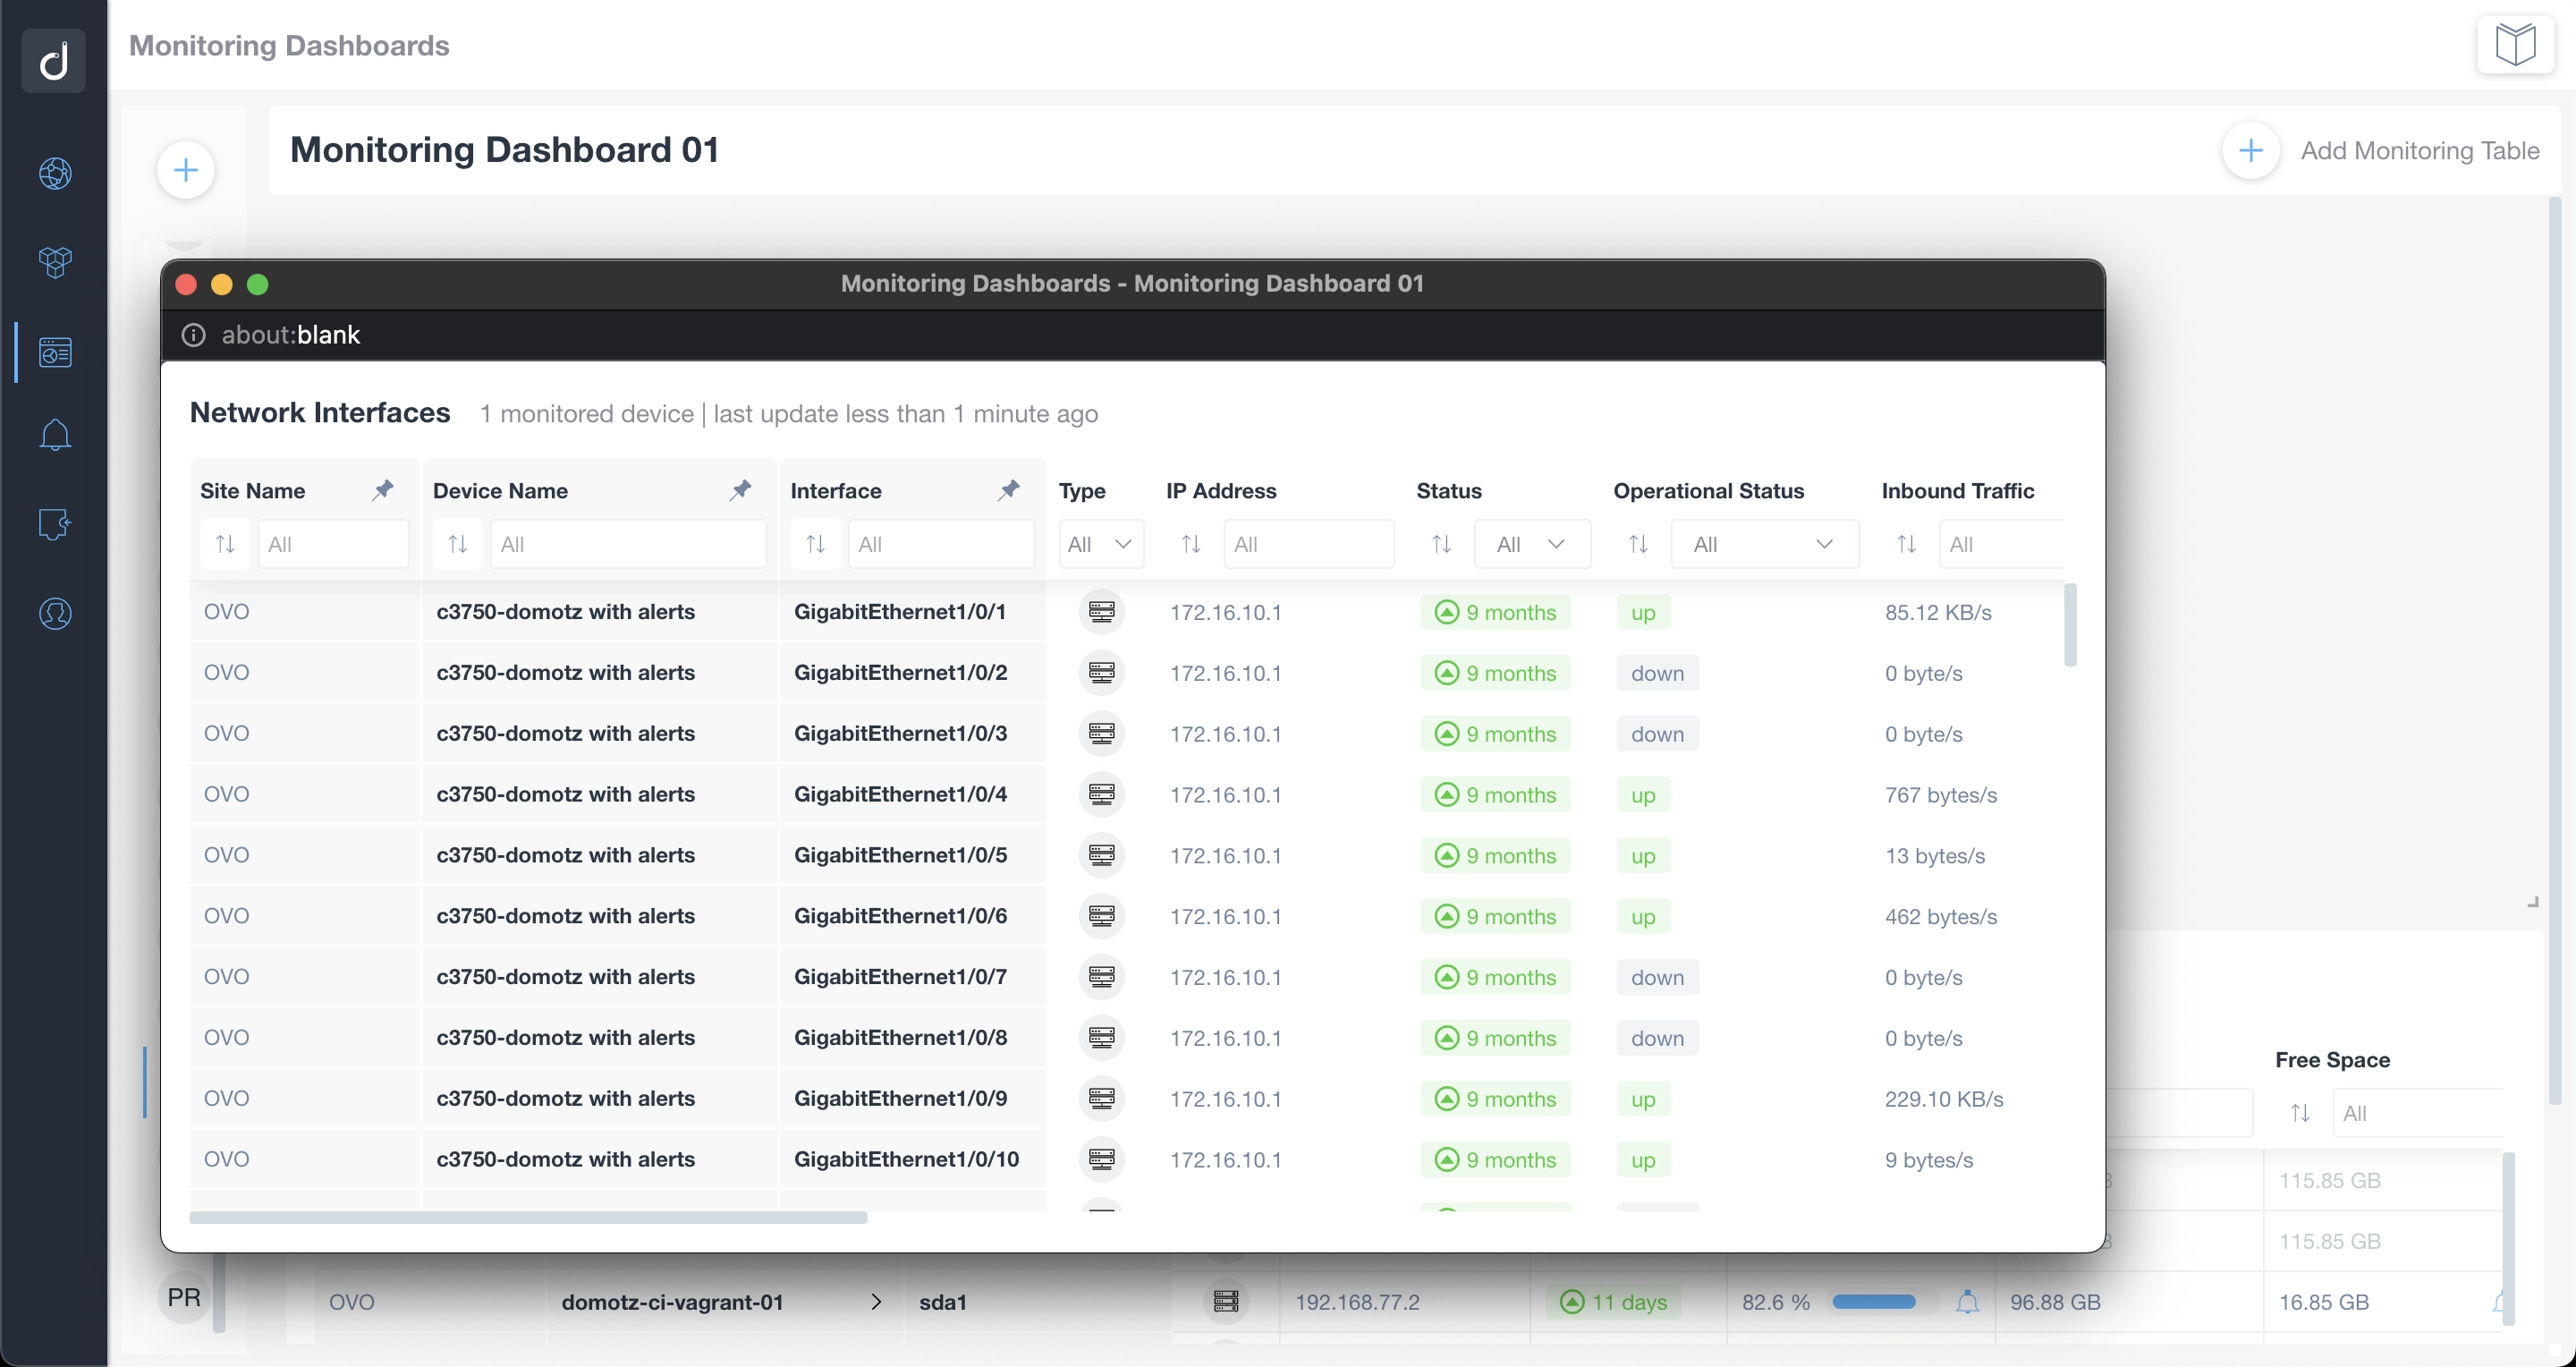
Customize the tables in your network monitoring dashboards with information you choose from different sites and devices.
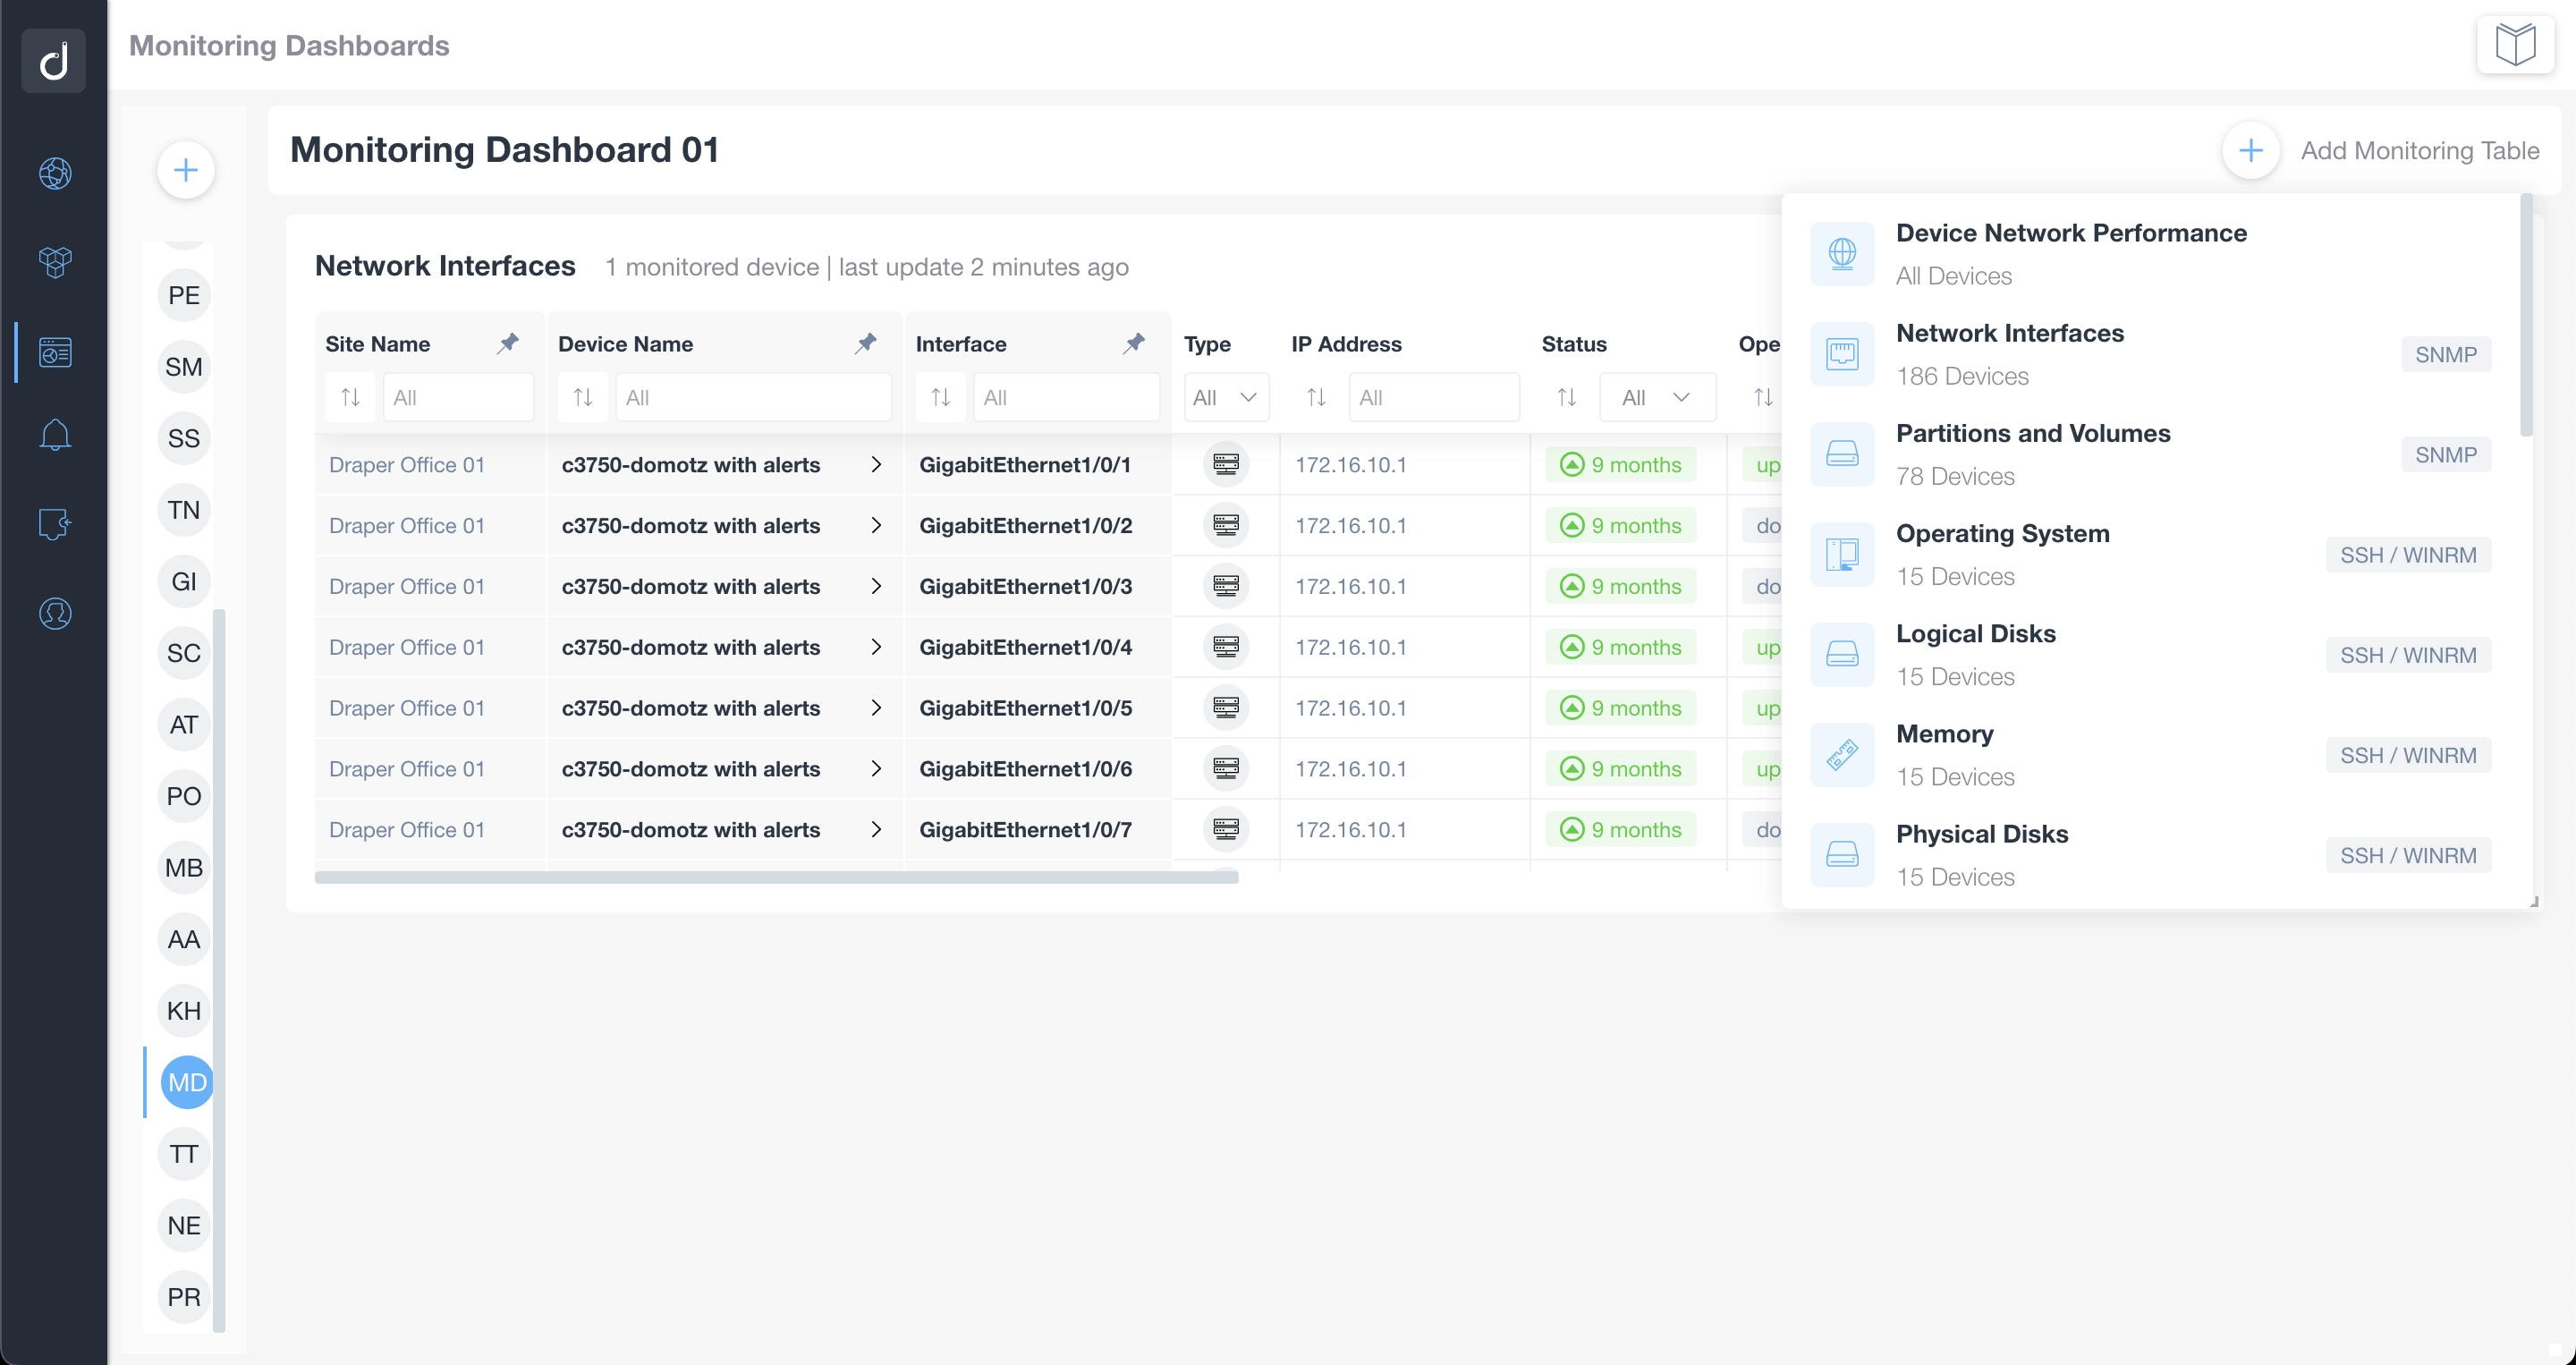
Quickly sort, filter, and visualize multiple sites in your network monitoring dashboards. Easily and quickly access the information you need.
Your network monitoring dashboard, your way!
Visualize information across all your sites
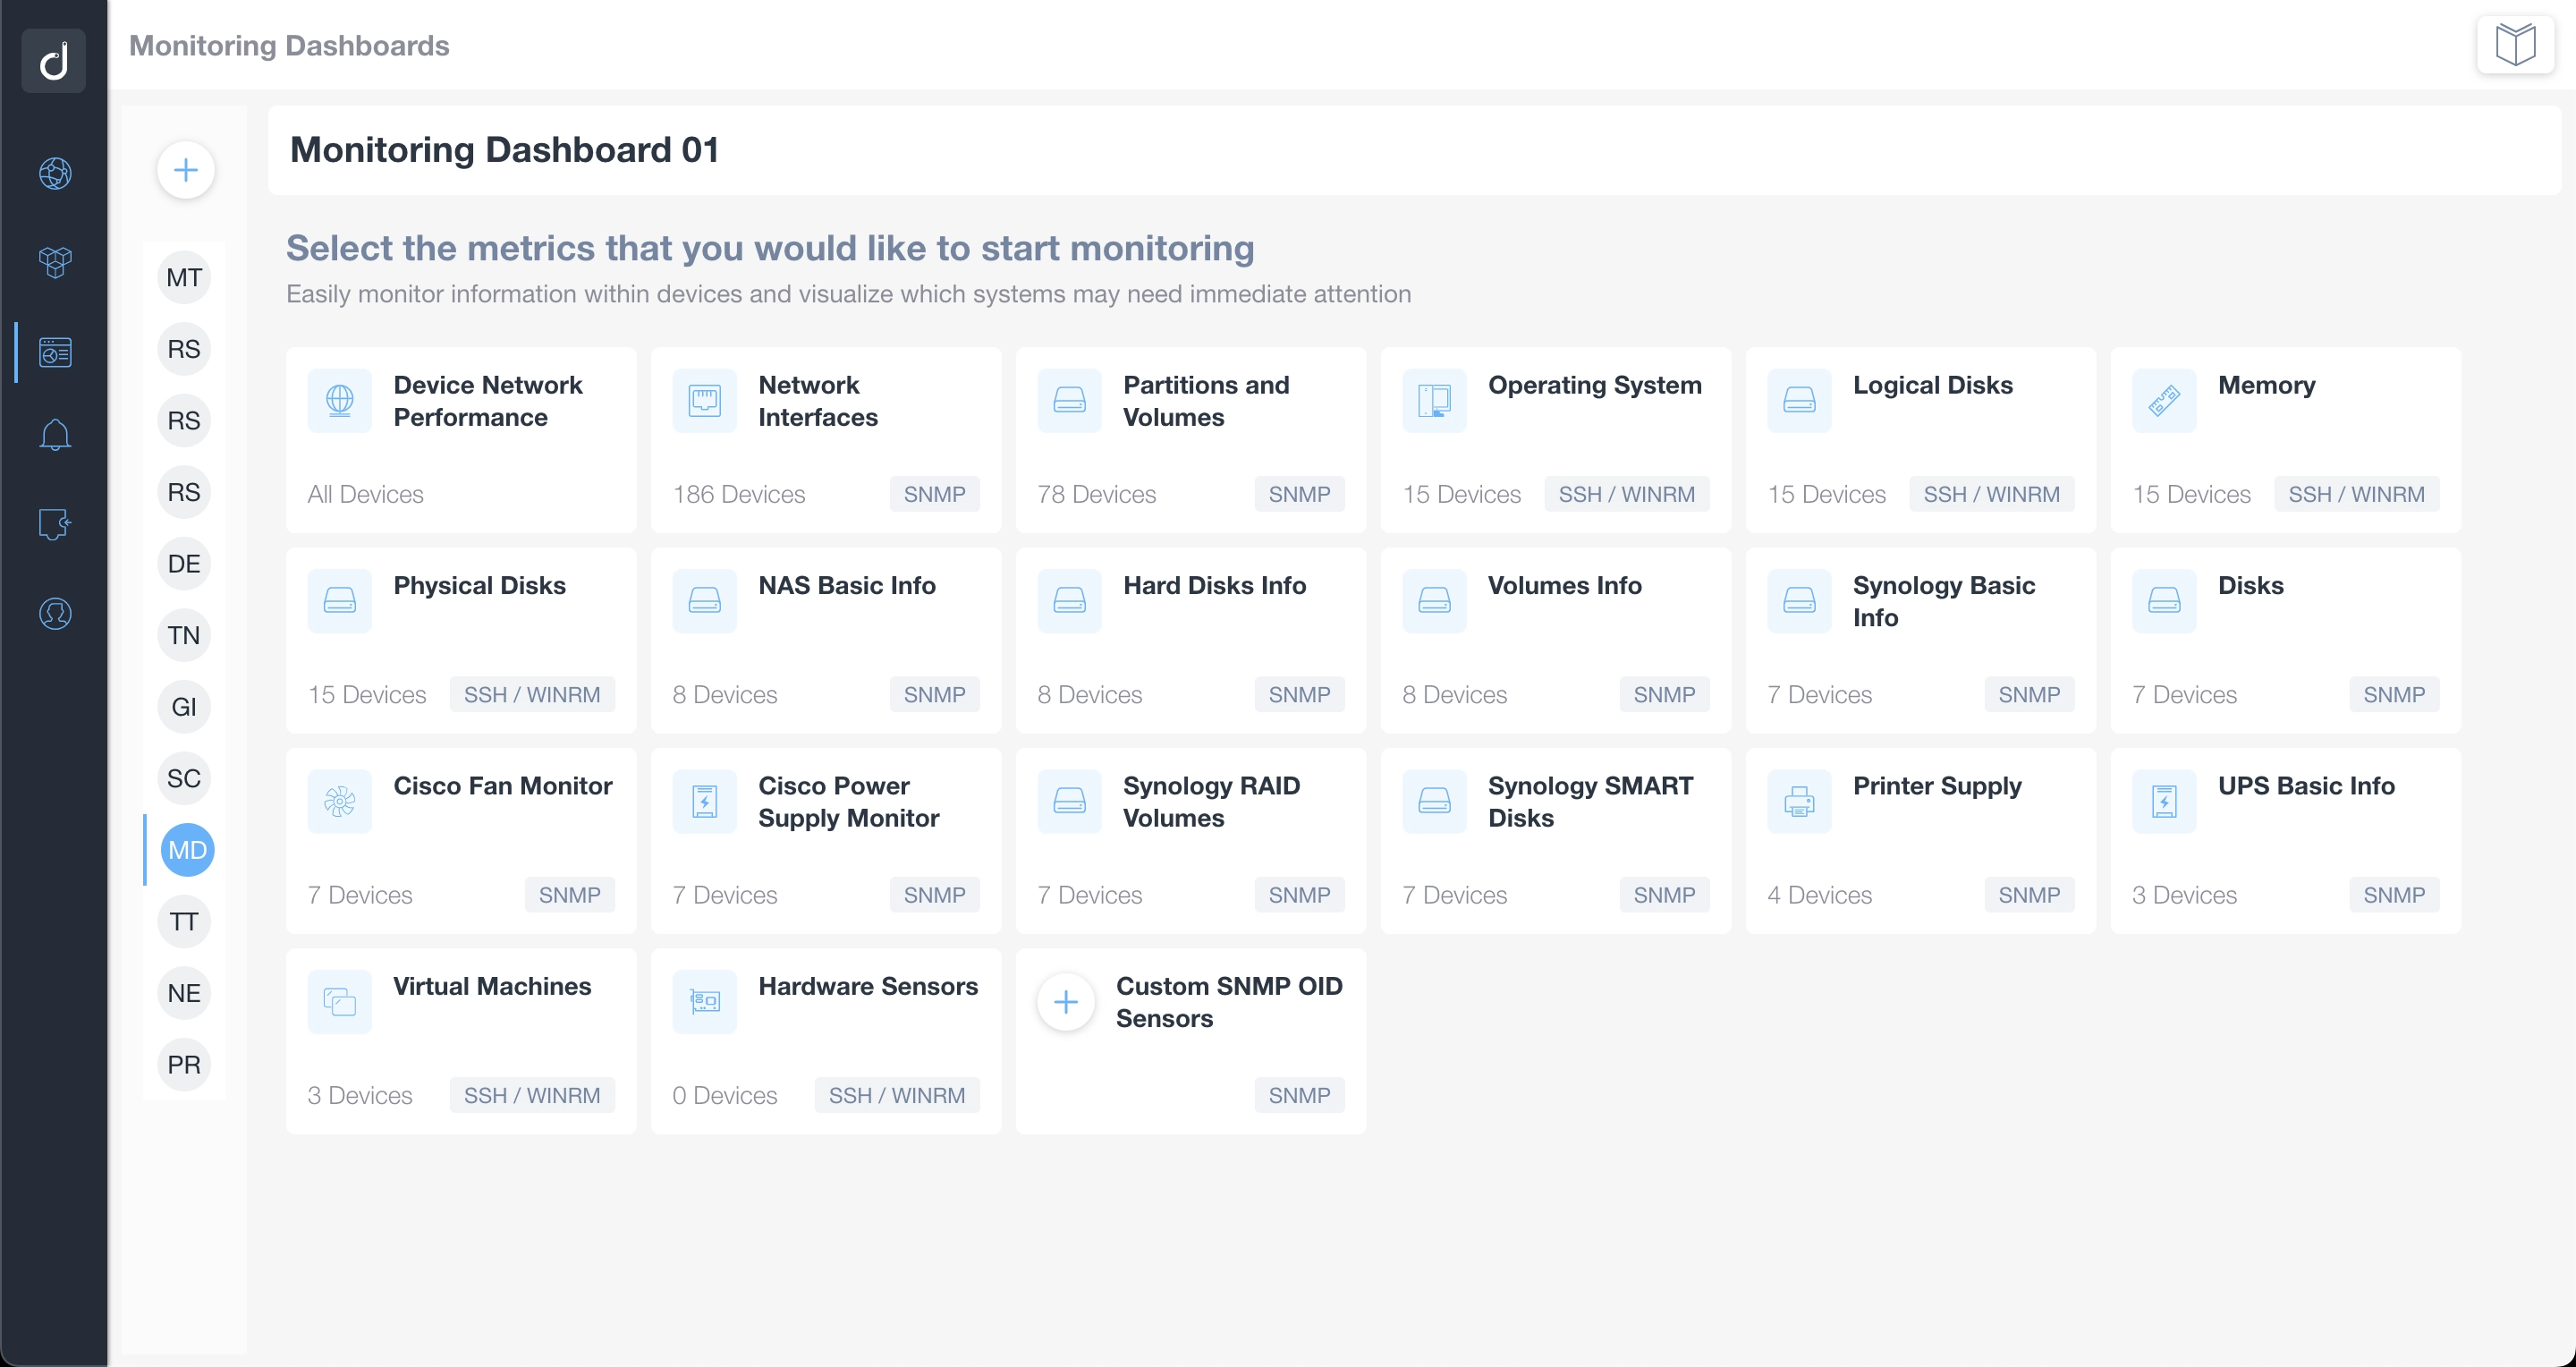
Our Network Monitoring Dashboards let you choose what information you see. Choose specific device, site, and custom integration information to add to a dashboard:
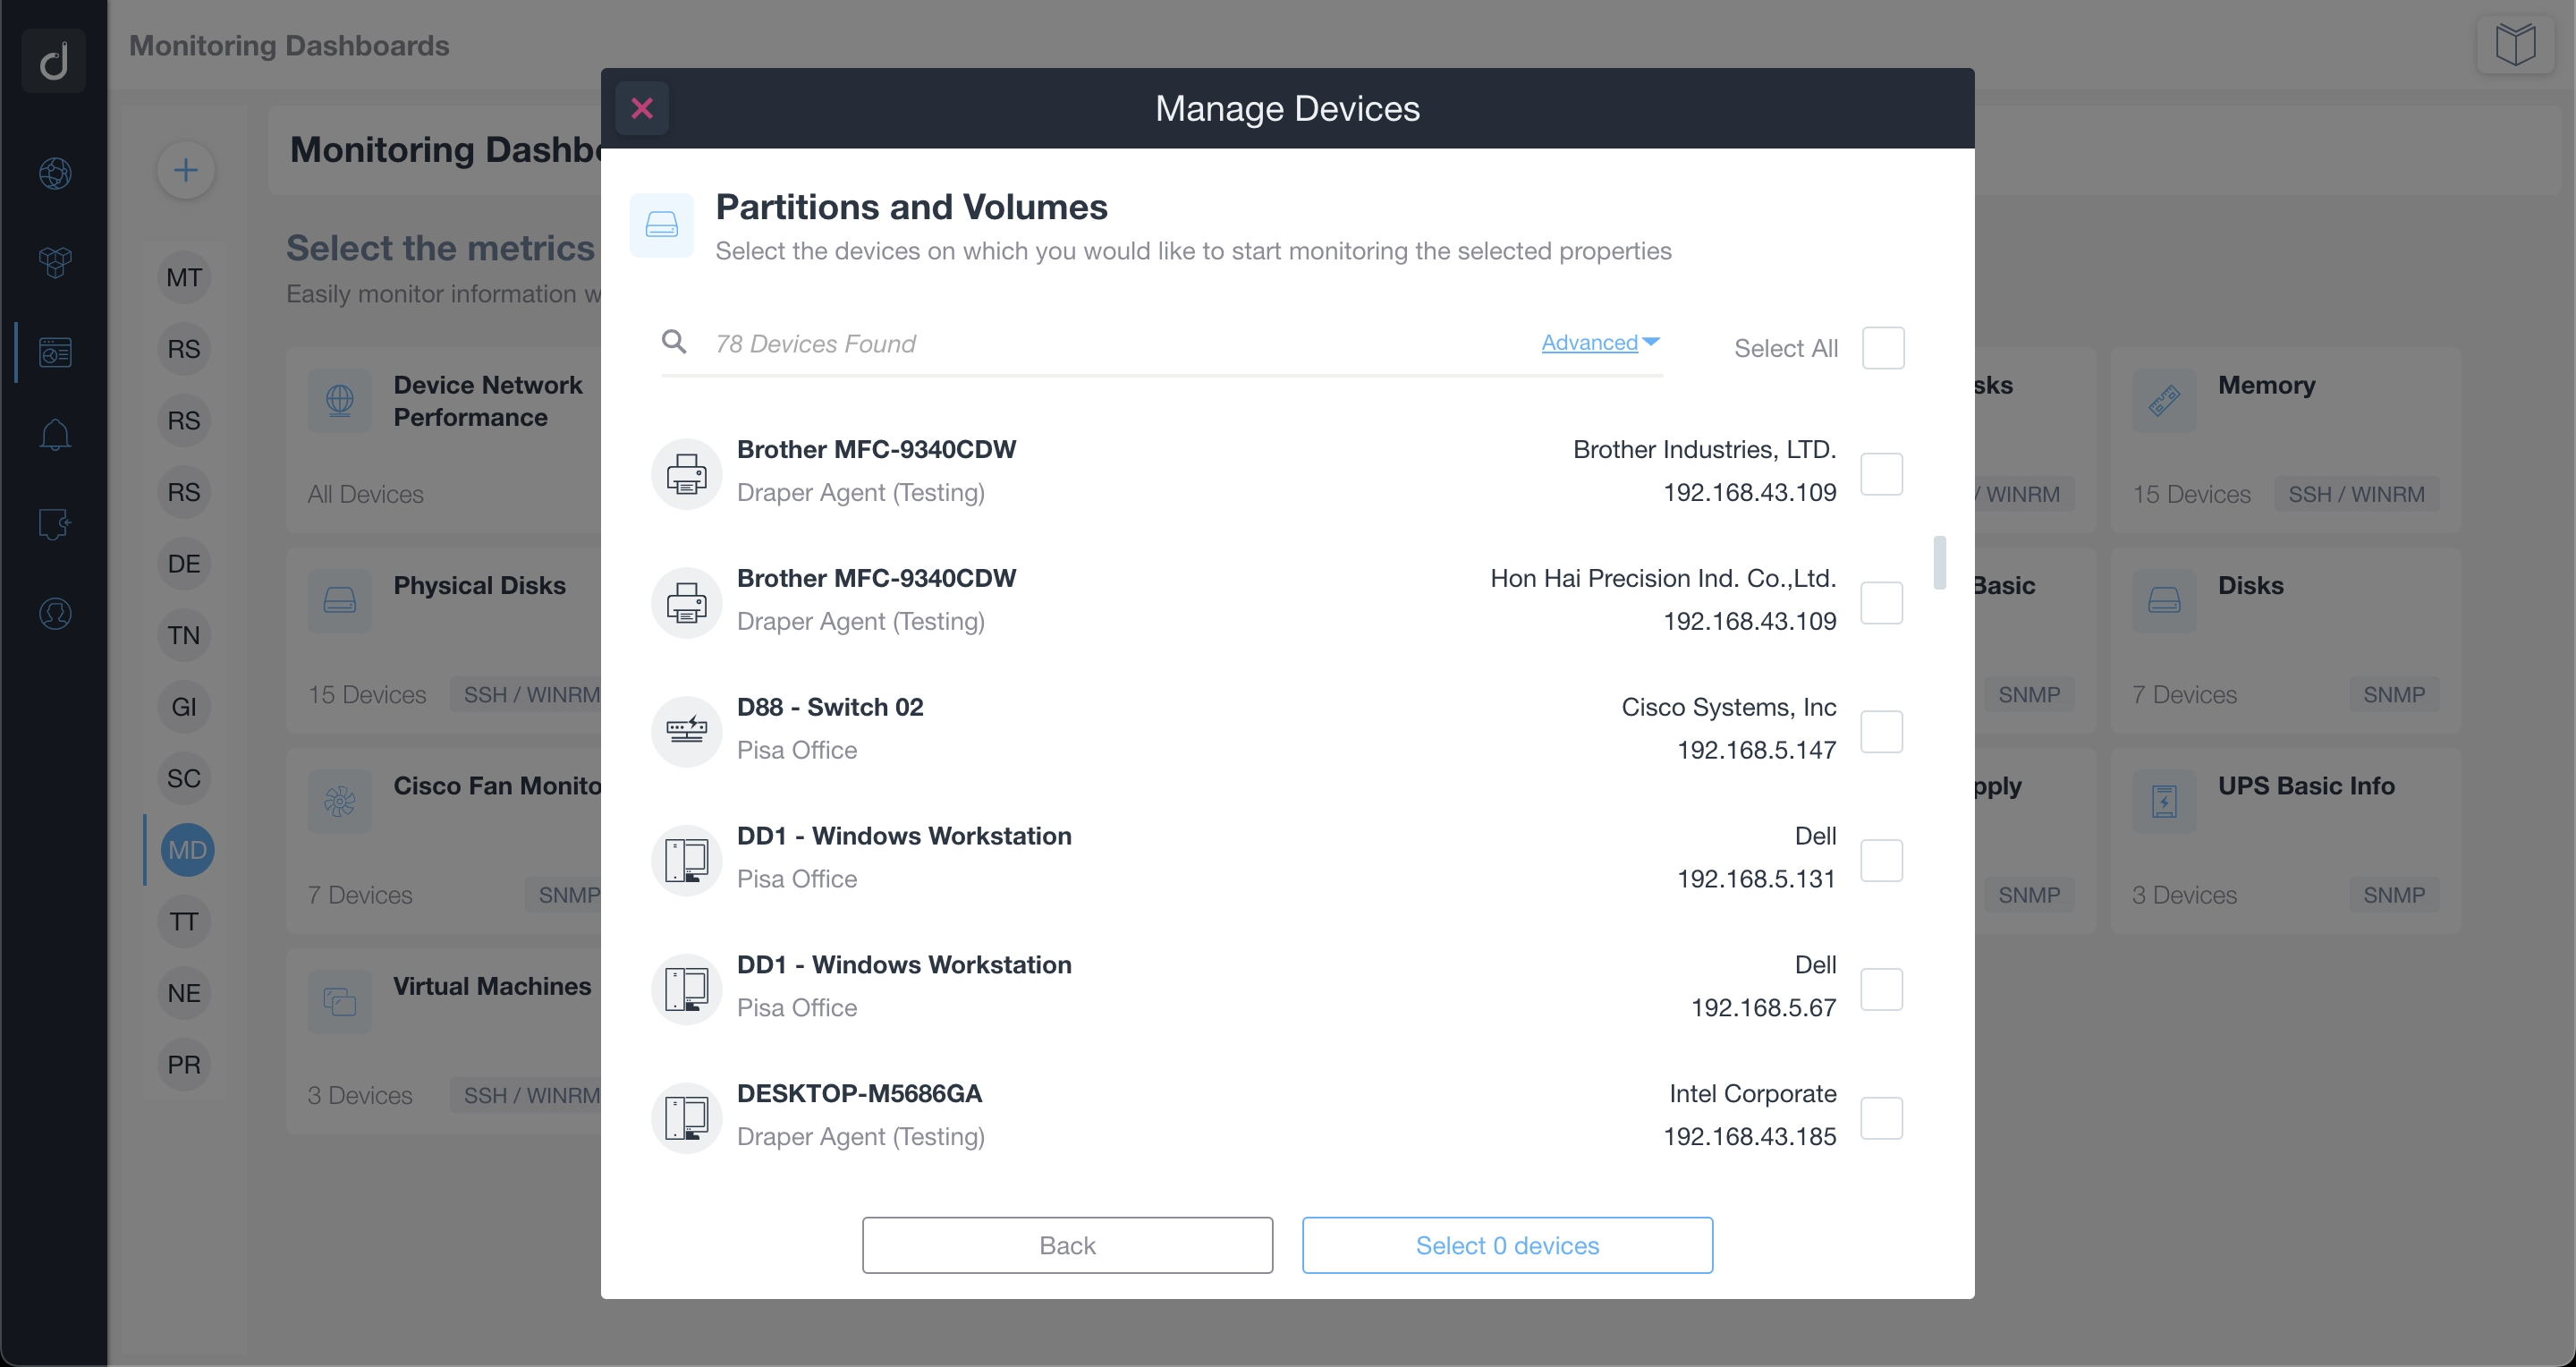
- Select which devices to monitor
- Choose what data to monitor
- Organize this information by creating your Monitoring Dashboards with multiple Monitoring Tables in each Dashboard
- Create, change, edit, customize, filter, sort, or remove information whenever you want
- Configure and display SNMP sensor values on multiple devices at once and across sites
Expand your network monitoring capabilities
Creating a network monitoring dashboard is so easy. Monitor specific device information and visualize any systems that need immediate attention.
Look at the data about your devices and sites in an intelligent way.
Create network monitoring tables using our Custom Integration functionality. Retrieve additional data about your devices and view it in a dashboard.
You can also share your network monitoring dashboards with your team, so that members can view essential information.
Create Dynamic Tables
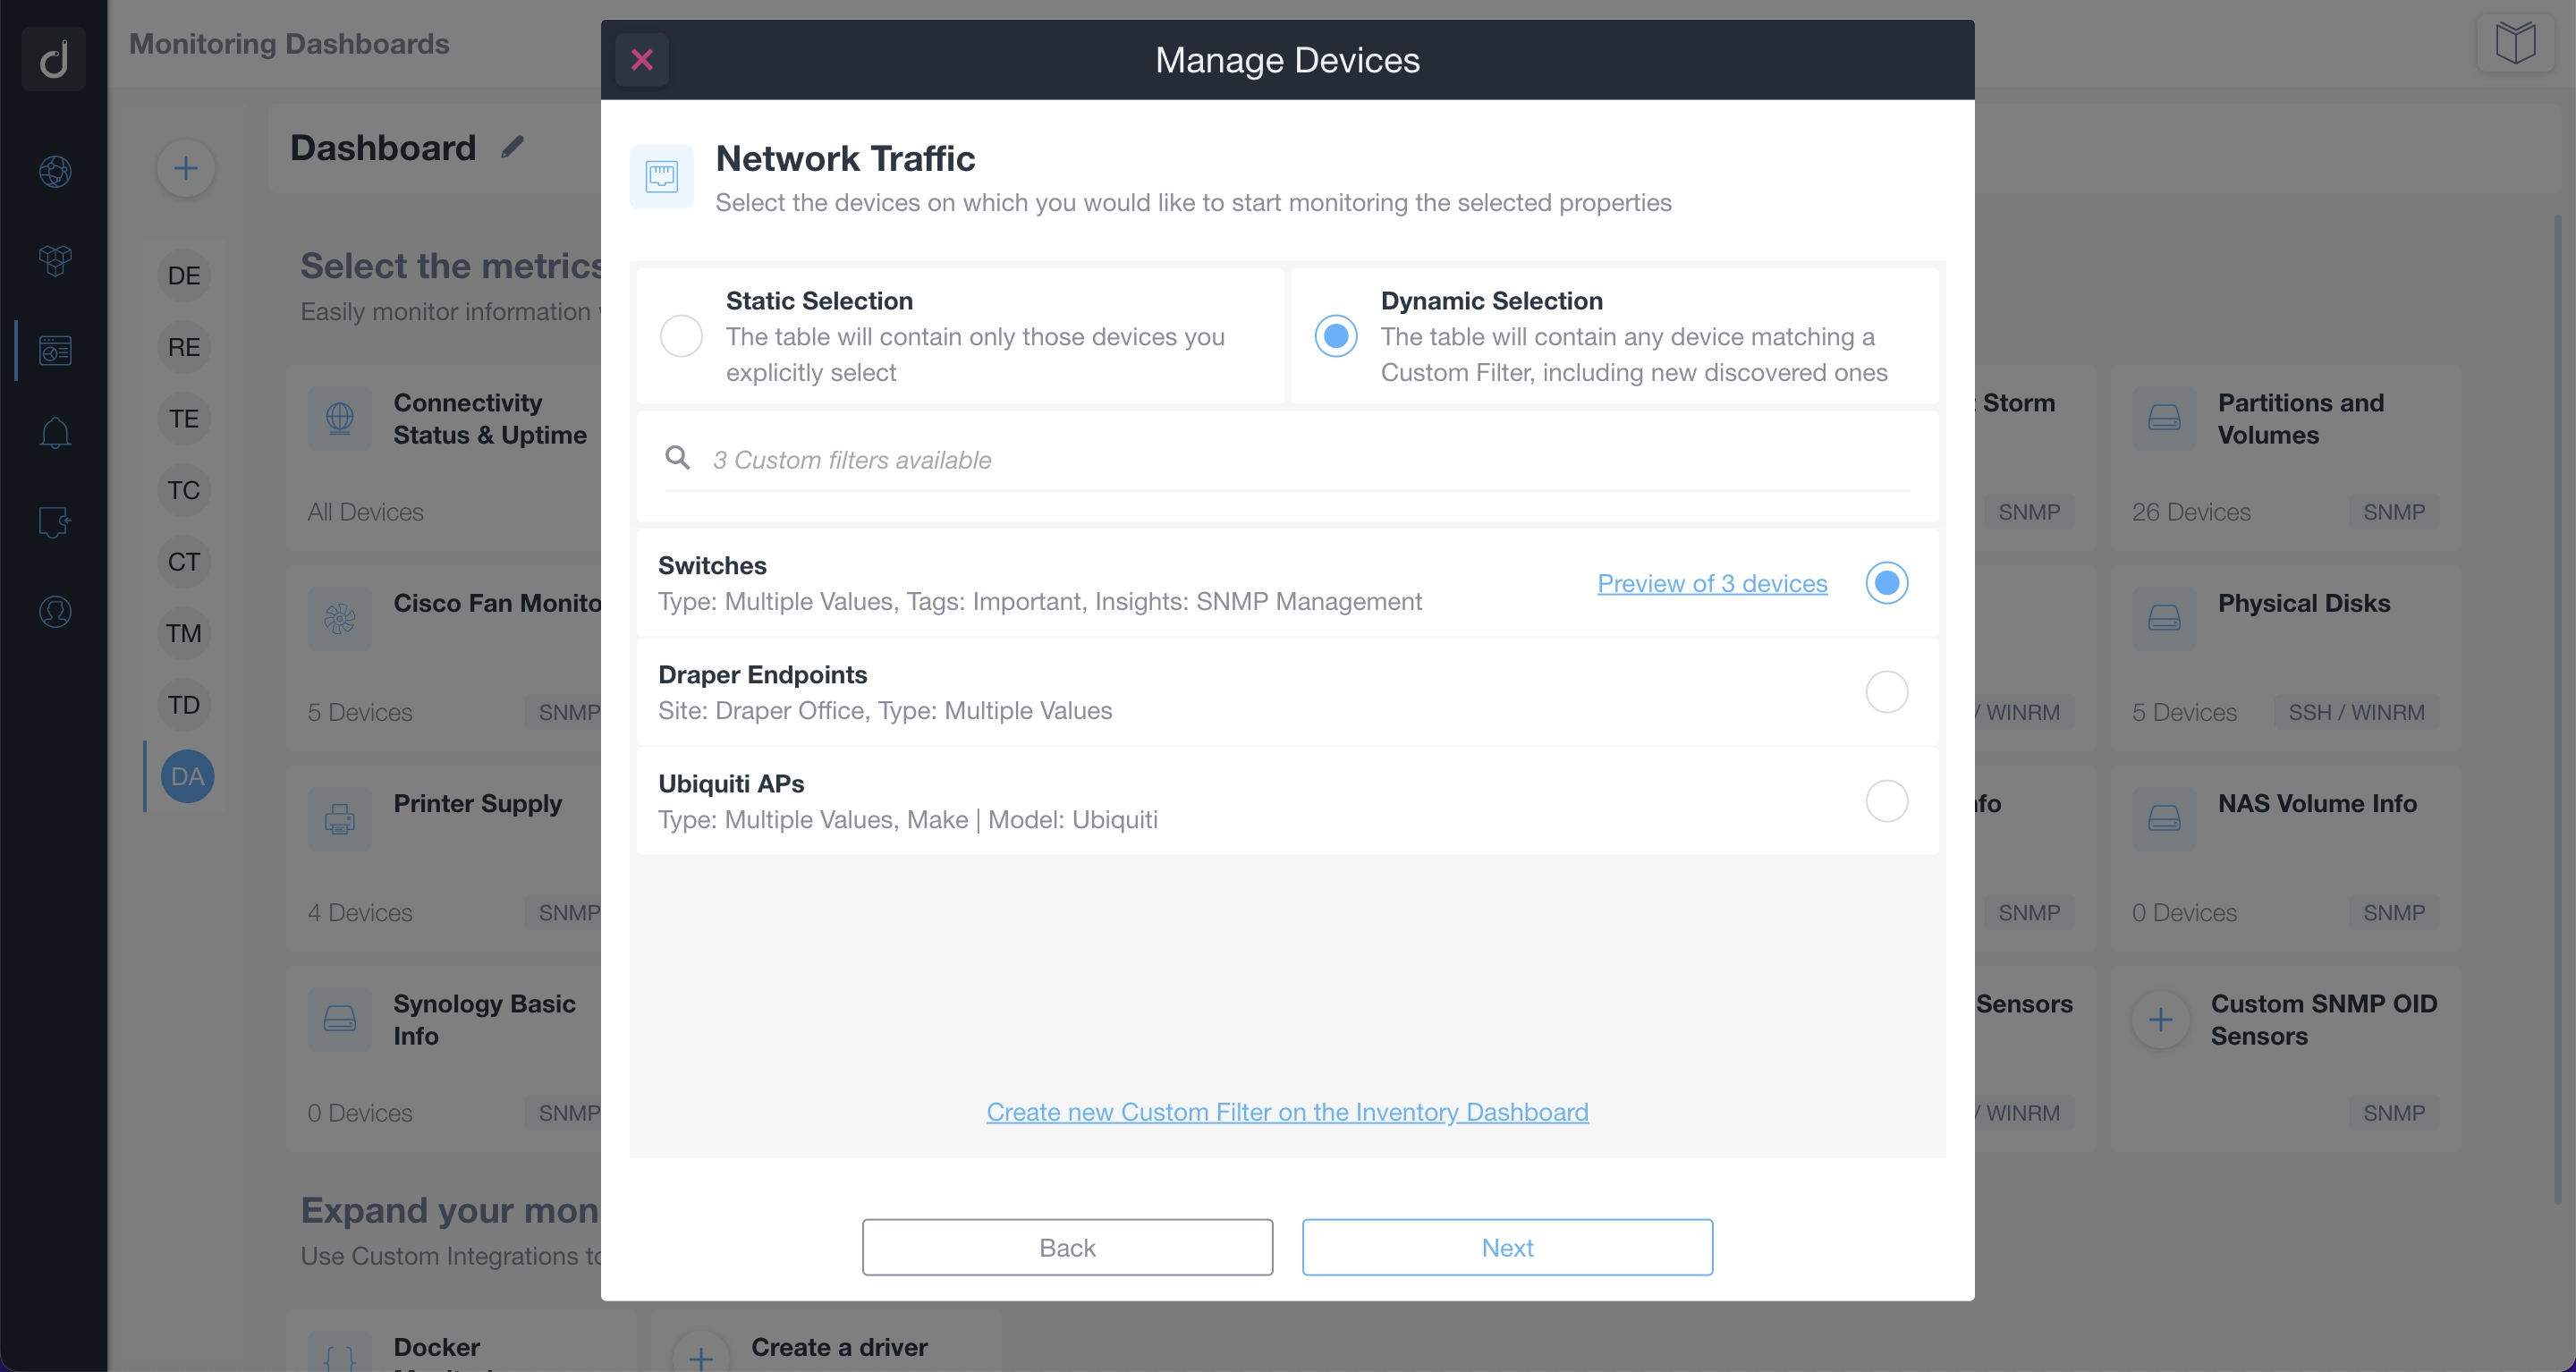
Easily create dynamic monitoring tables using custom filters.
By leveraging custom filters, you can define specific criteria for including devices in your monitoring tables. A new device automatically appears in the table whenever it meets the filter conditions. Moreover, you can create monitoring tables that adapt to changes in your network environment.
No more manually updating your monitoring tables. Embrace the power of automation with dynamic device lists in your monitoring tables. Simplify your monitoring workflows and get real-time updates.
Additionally, you can switch from static to dynamic table type in just a few clicks. Dynamically monitor all your devices, including newly discovered ones.


Ready to Get Started?
- Uncover Network Blind Spots
- Resolve Issues Faster and Easier
- Exceed Service Delivery Expectations