Monitor Kubernetes clusters with Domotz
Kubernetes Monitoring is available through Domotz network monitoring software. Proactively watch over your Kubernetes Cluster status, Nodes/Pods, and other API metrics.
Kubernetes is an open-source container-orchestration system for automating software deployment, scaling, and managing containerized applications. Google is the system designer, and the Cloud Native Computing Foundation now maintains it.
Kubernetes works with Containerd and CRI-O. Initially, it interfaced exclusively with the Docker runtime through a "Dockershim." However, since November 2020, Kubernetes has deprecated the shim in favor of directly interfacing with the container through Containerd or replacing Docker with a runtime compliant with the Container Runtime Interface (CRI). (cit. Wikipedia)

How to monitor Kubernetes
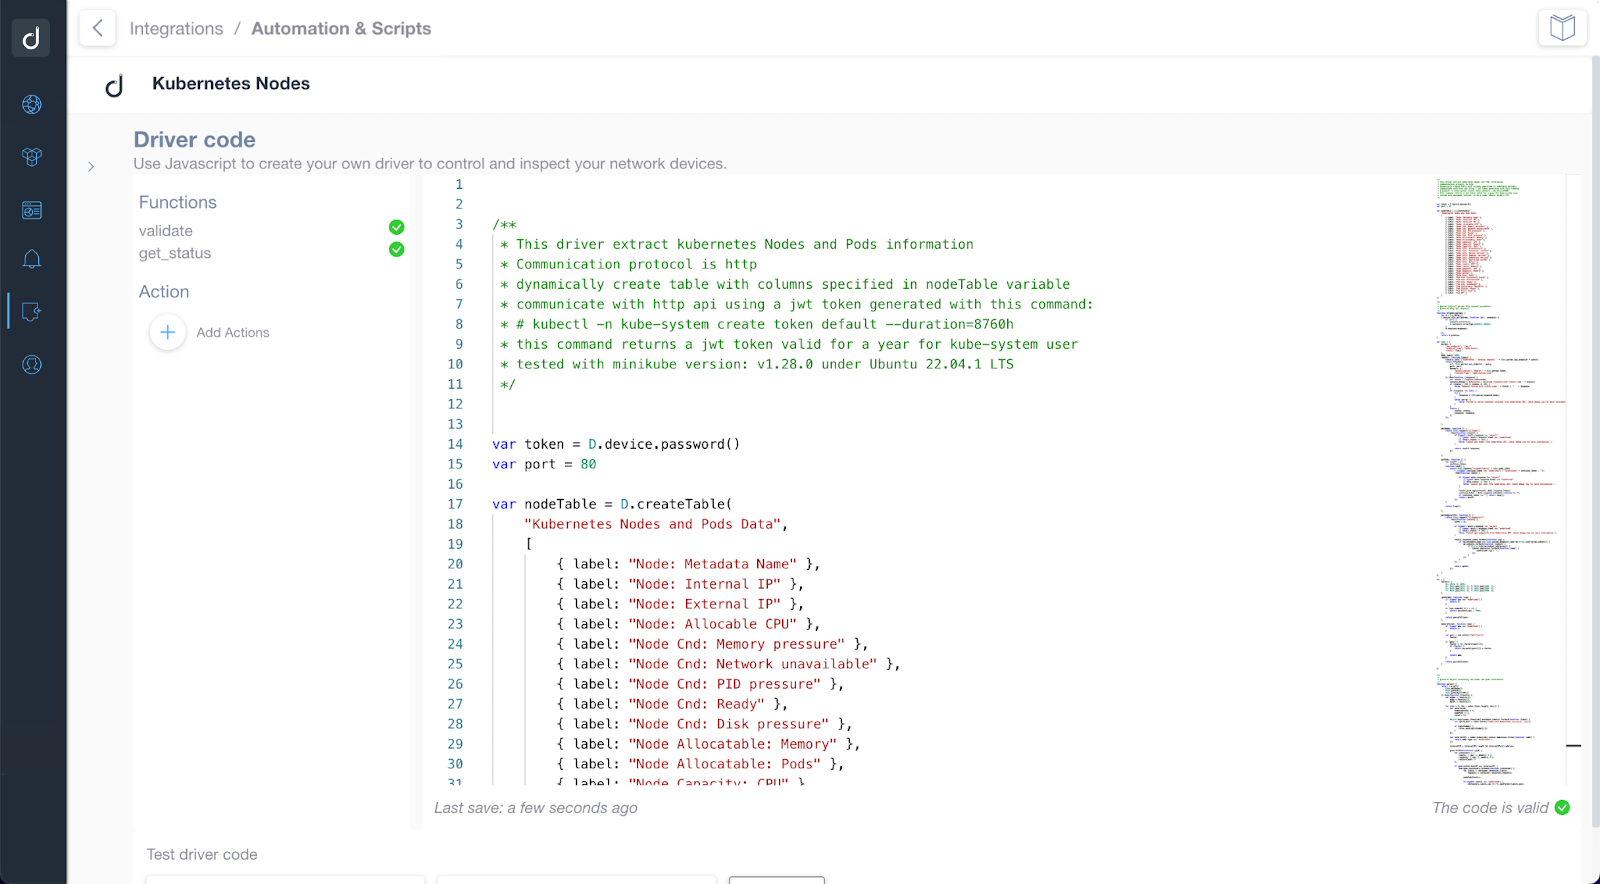
Our Kubernetes Monitoring scripts use the HTTP-based API to access information. You require generating a jwt token in the Kubernetes Cluster to connect with Domotz for monitoring.
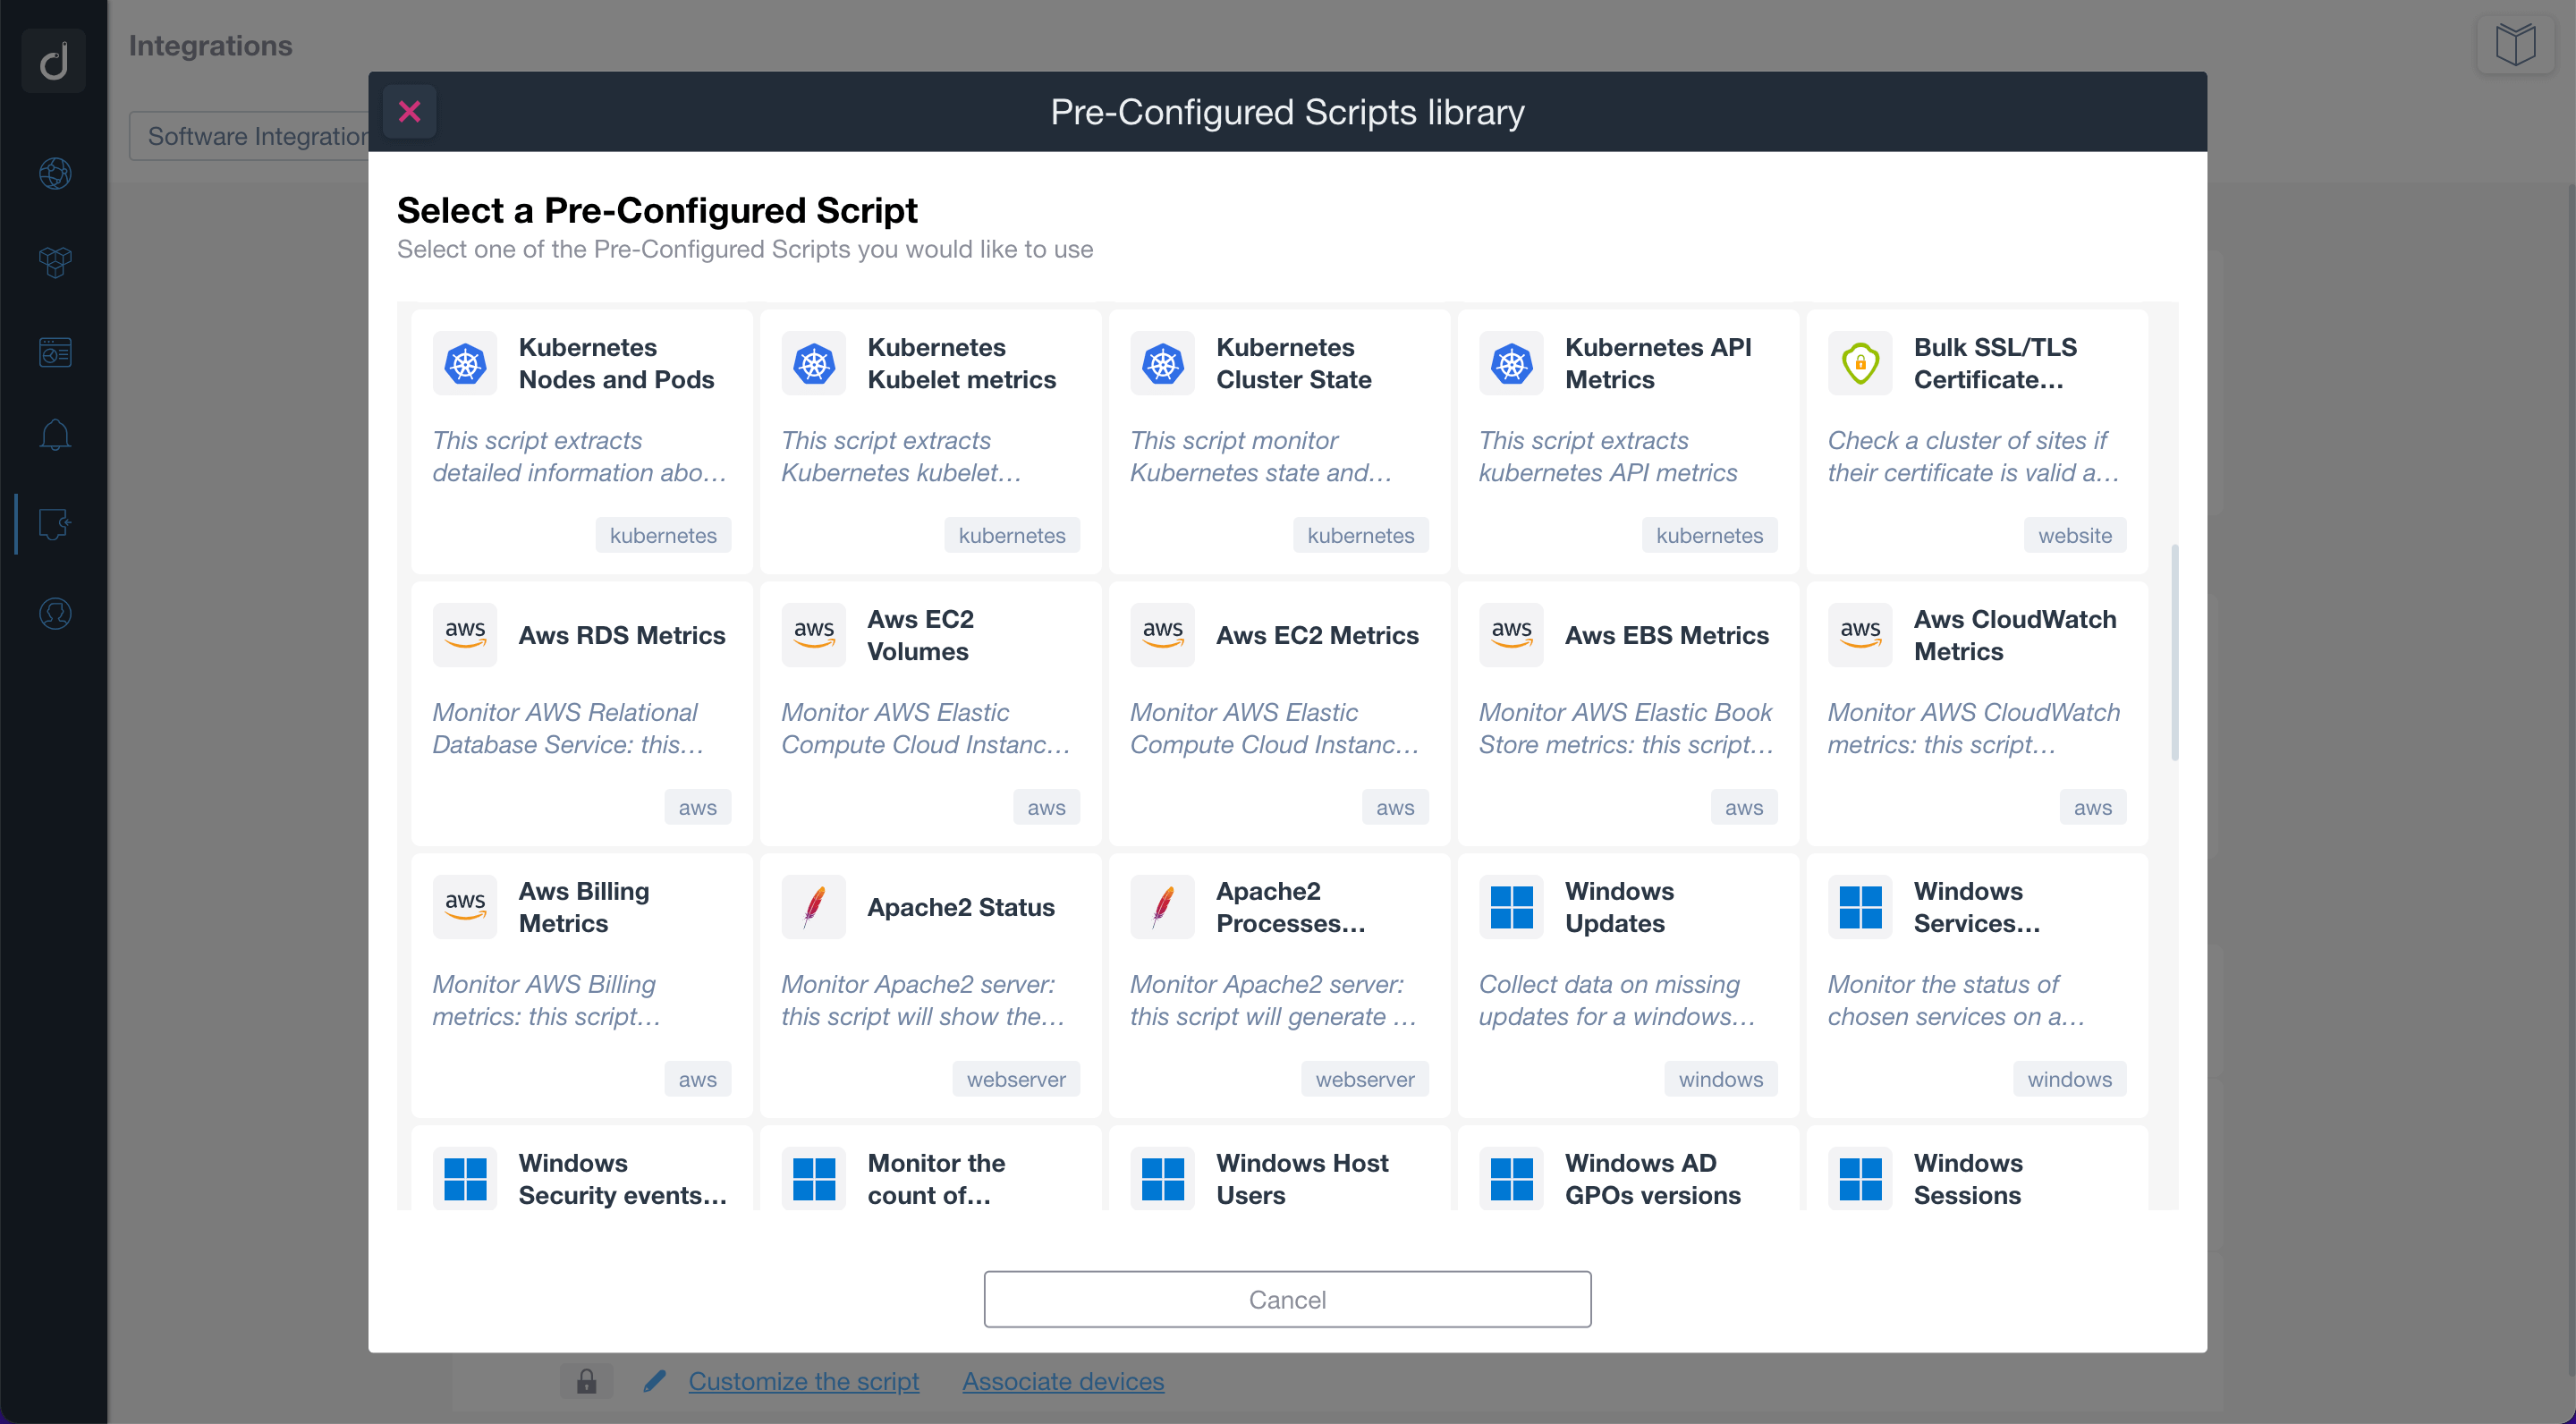
Two different custom scripts offer an initial set of variables and stats that you can monitor through Domotz:
- kubernetes_api_metrics.js - this script dynamically creates metrics for Kubernetes API depending from the response of the service, such as Server requests, CPUs, threads, routines, etc
- kubernetes_nodes.js - this script dynamically creates a table with columns specified in nodeTable variable and refer to the Nodes/Pods configured in the Kubernetes Cluster
- kubernetes_scheduler.js - this script is able to extract information about the Kubernetes scheduler (such as CPU consumption, fds open and max, memory usage, etc)
- kubernetes_cluster_state.js - this script allows the Domotz user to retrieve status data about the Kubernetes Clusters
- kubernetes_kubelet.js - this script extracts Kubernetes kubelet metrics by HTTP agent from Prometheus metrics endpoint
Find the Kubernetes Monitoring custom scripts in our examples library. Just customize them to fit your needs.
Easy Kubernetes monitoring for nodes, pods, scheduler and Kubelet
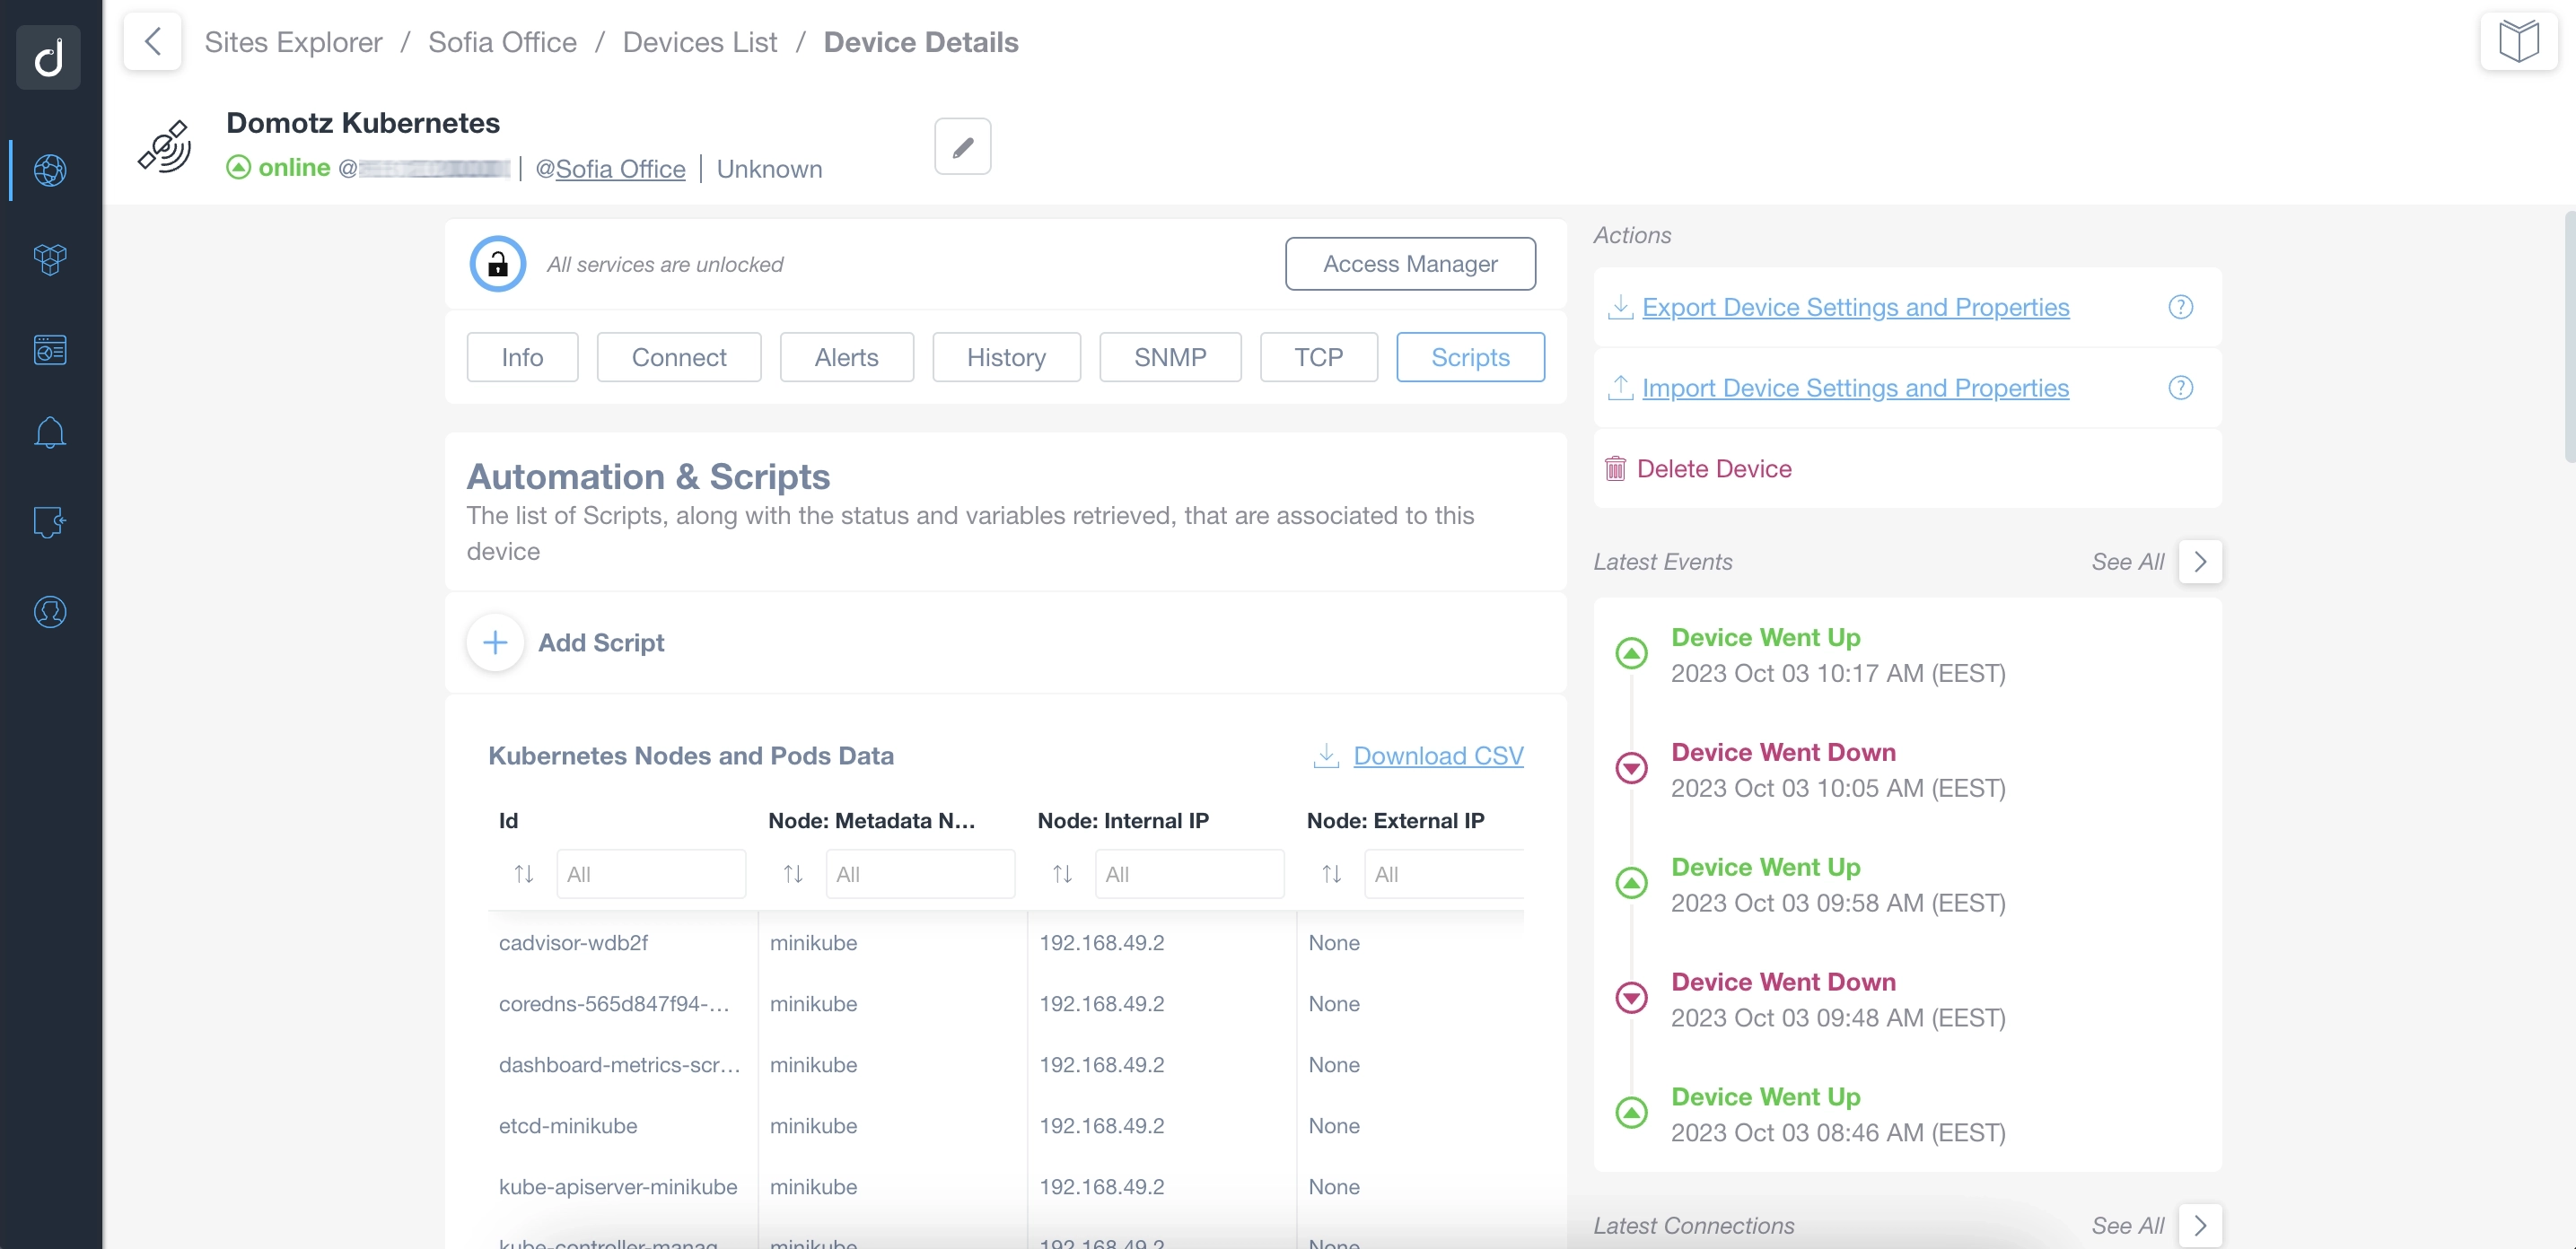
Thanks to our Kubernetes Monitoring, you can correctly identify the configuration for each Node/Pod, check the limits and adjust them accordingly.
You can also review information for each node, including metadata, node limits, uptime, IP addresses, CPU and memory allocation, and more.
Additionally, we enable you to access information like the number of API server requests, CPU usage, go routines and threads, errors, virtual memory use, and more.
Finally, Domotz allows you to monitor the status of the clusters as well as review the scheduler configuration and the kubelet metrics.
Monitor the performance stats and info out of your Kubernetes Cluster
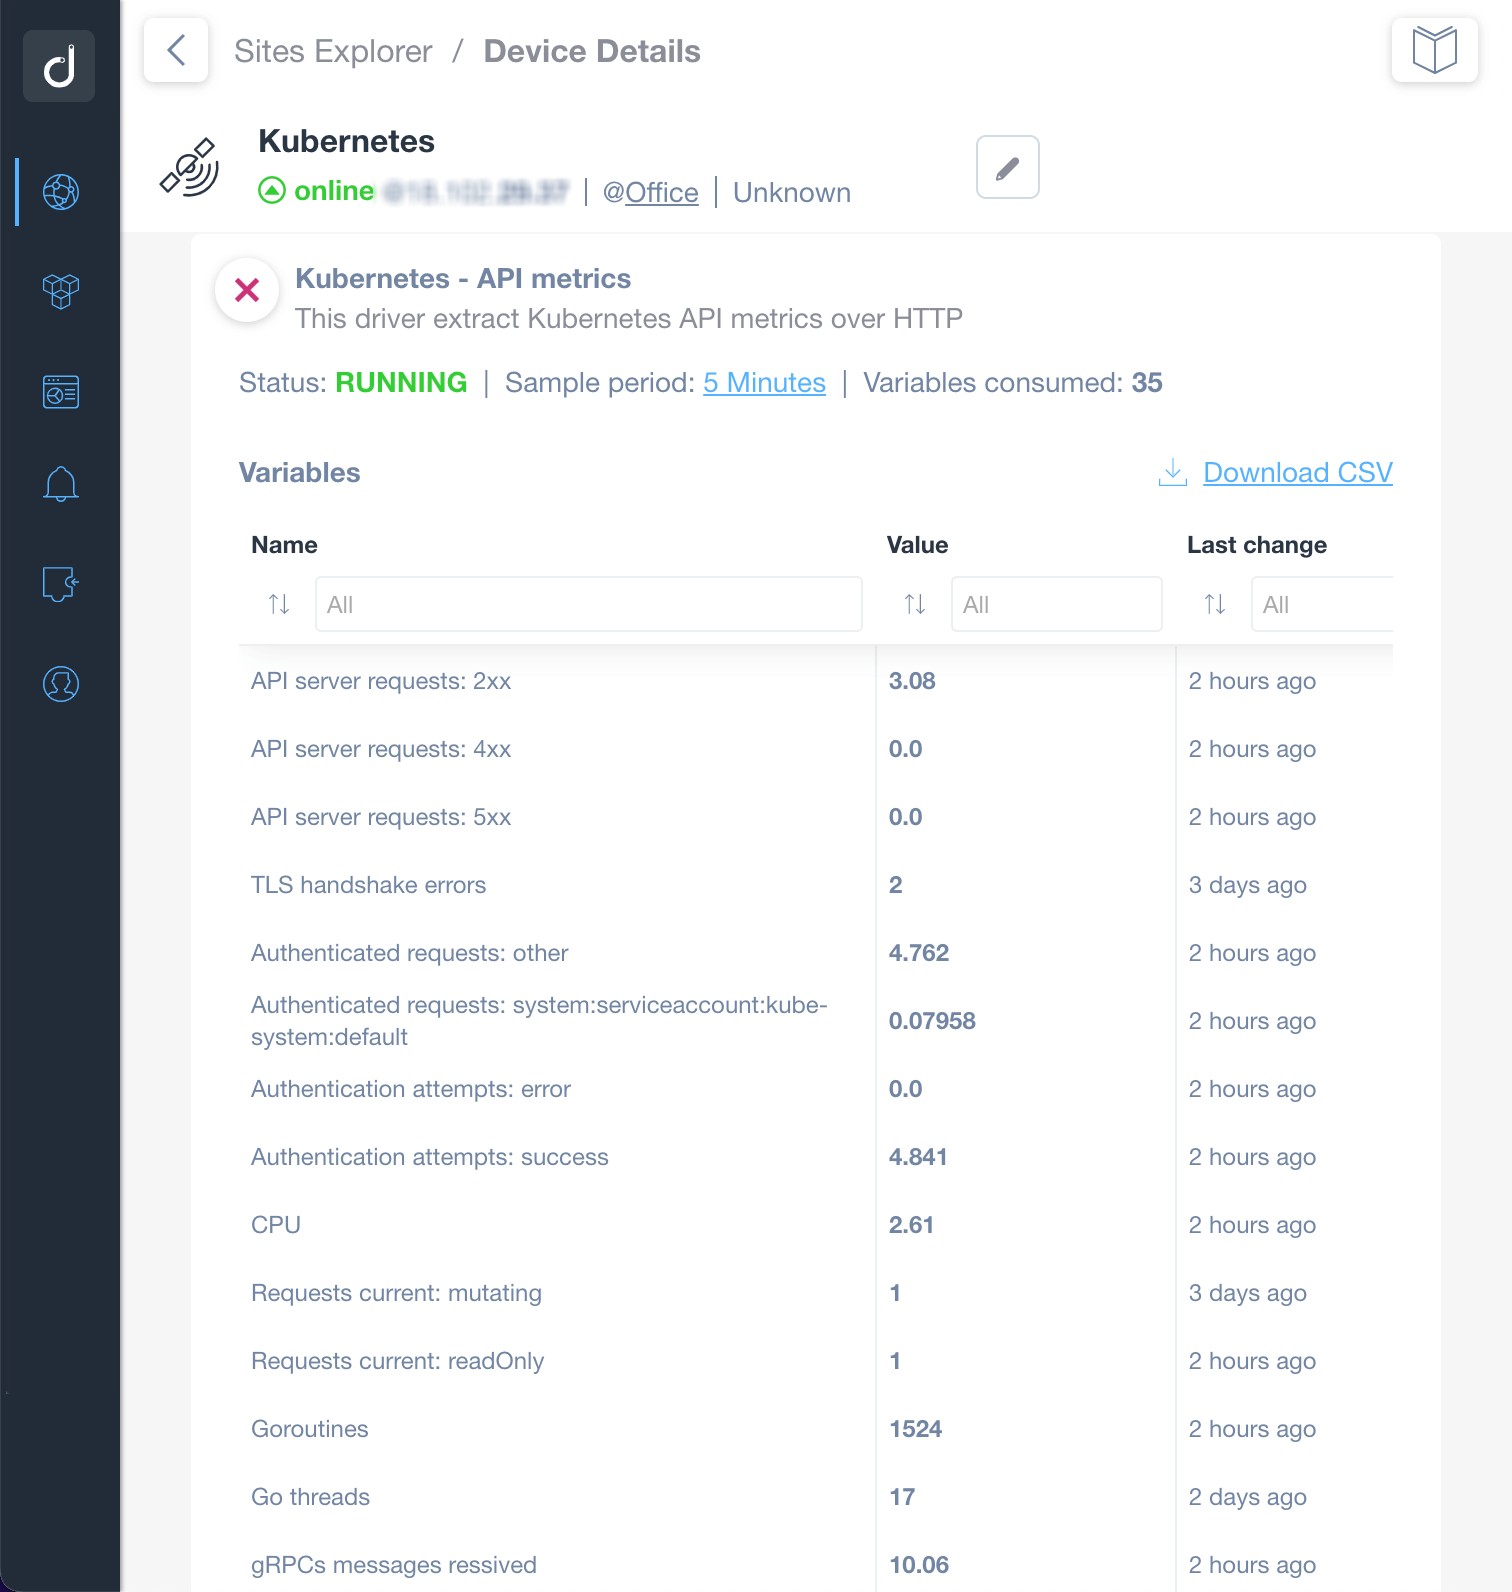
Extract the basic and advanced performance metrics from your Kubernetes Cluster directly from the API server. For example, you can start monitoring the following parameters:
- Number of API Server requests per category (e.g. 2xx, 3xx, 4xx, 5xx)
- TLS handshake errors
- Authenticated request numbers
- CPU and Memory usage
- Go Threads and Routines
- gRPCs messages sent and received
- and more
Full network visibility with ready-to-use scripts
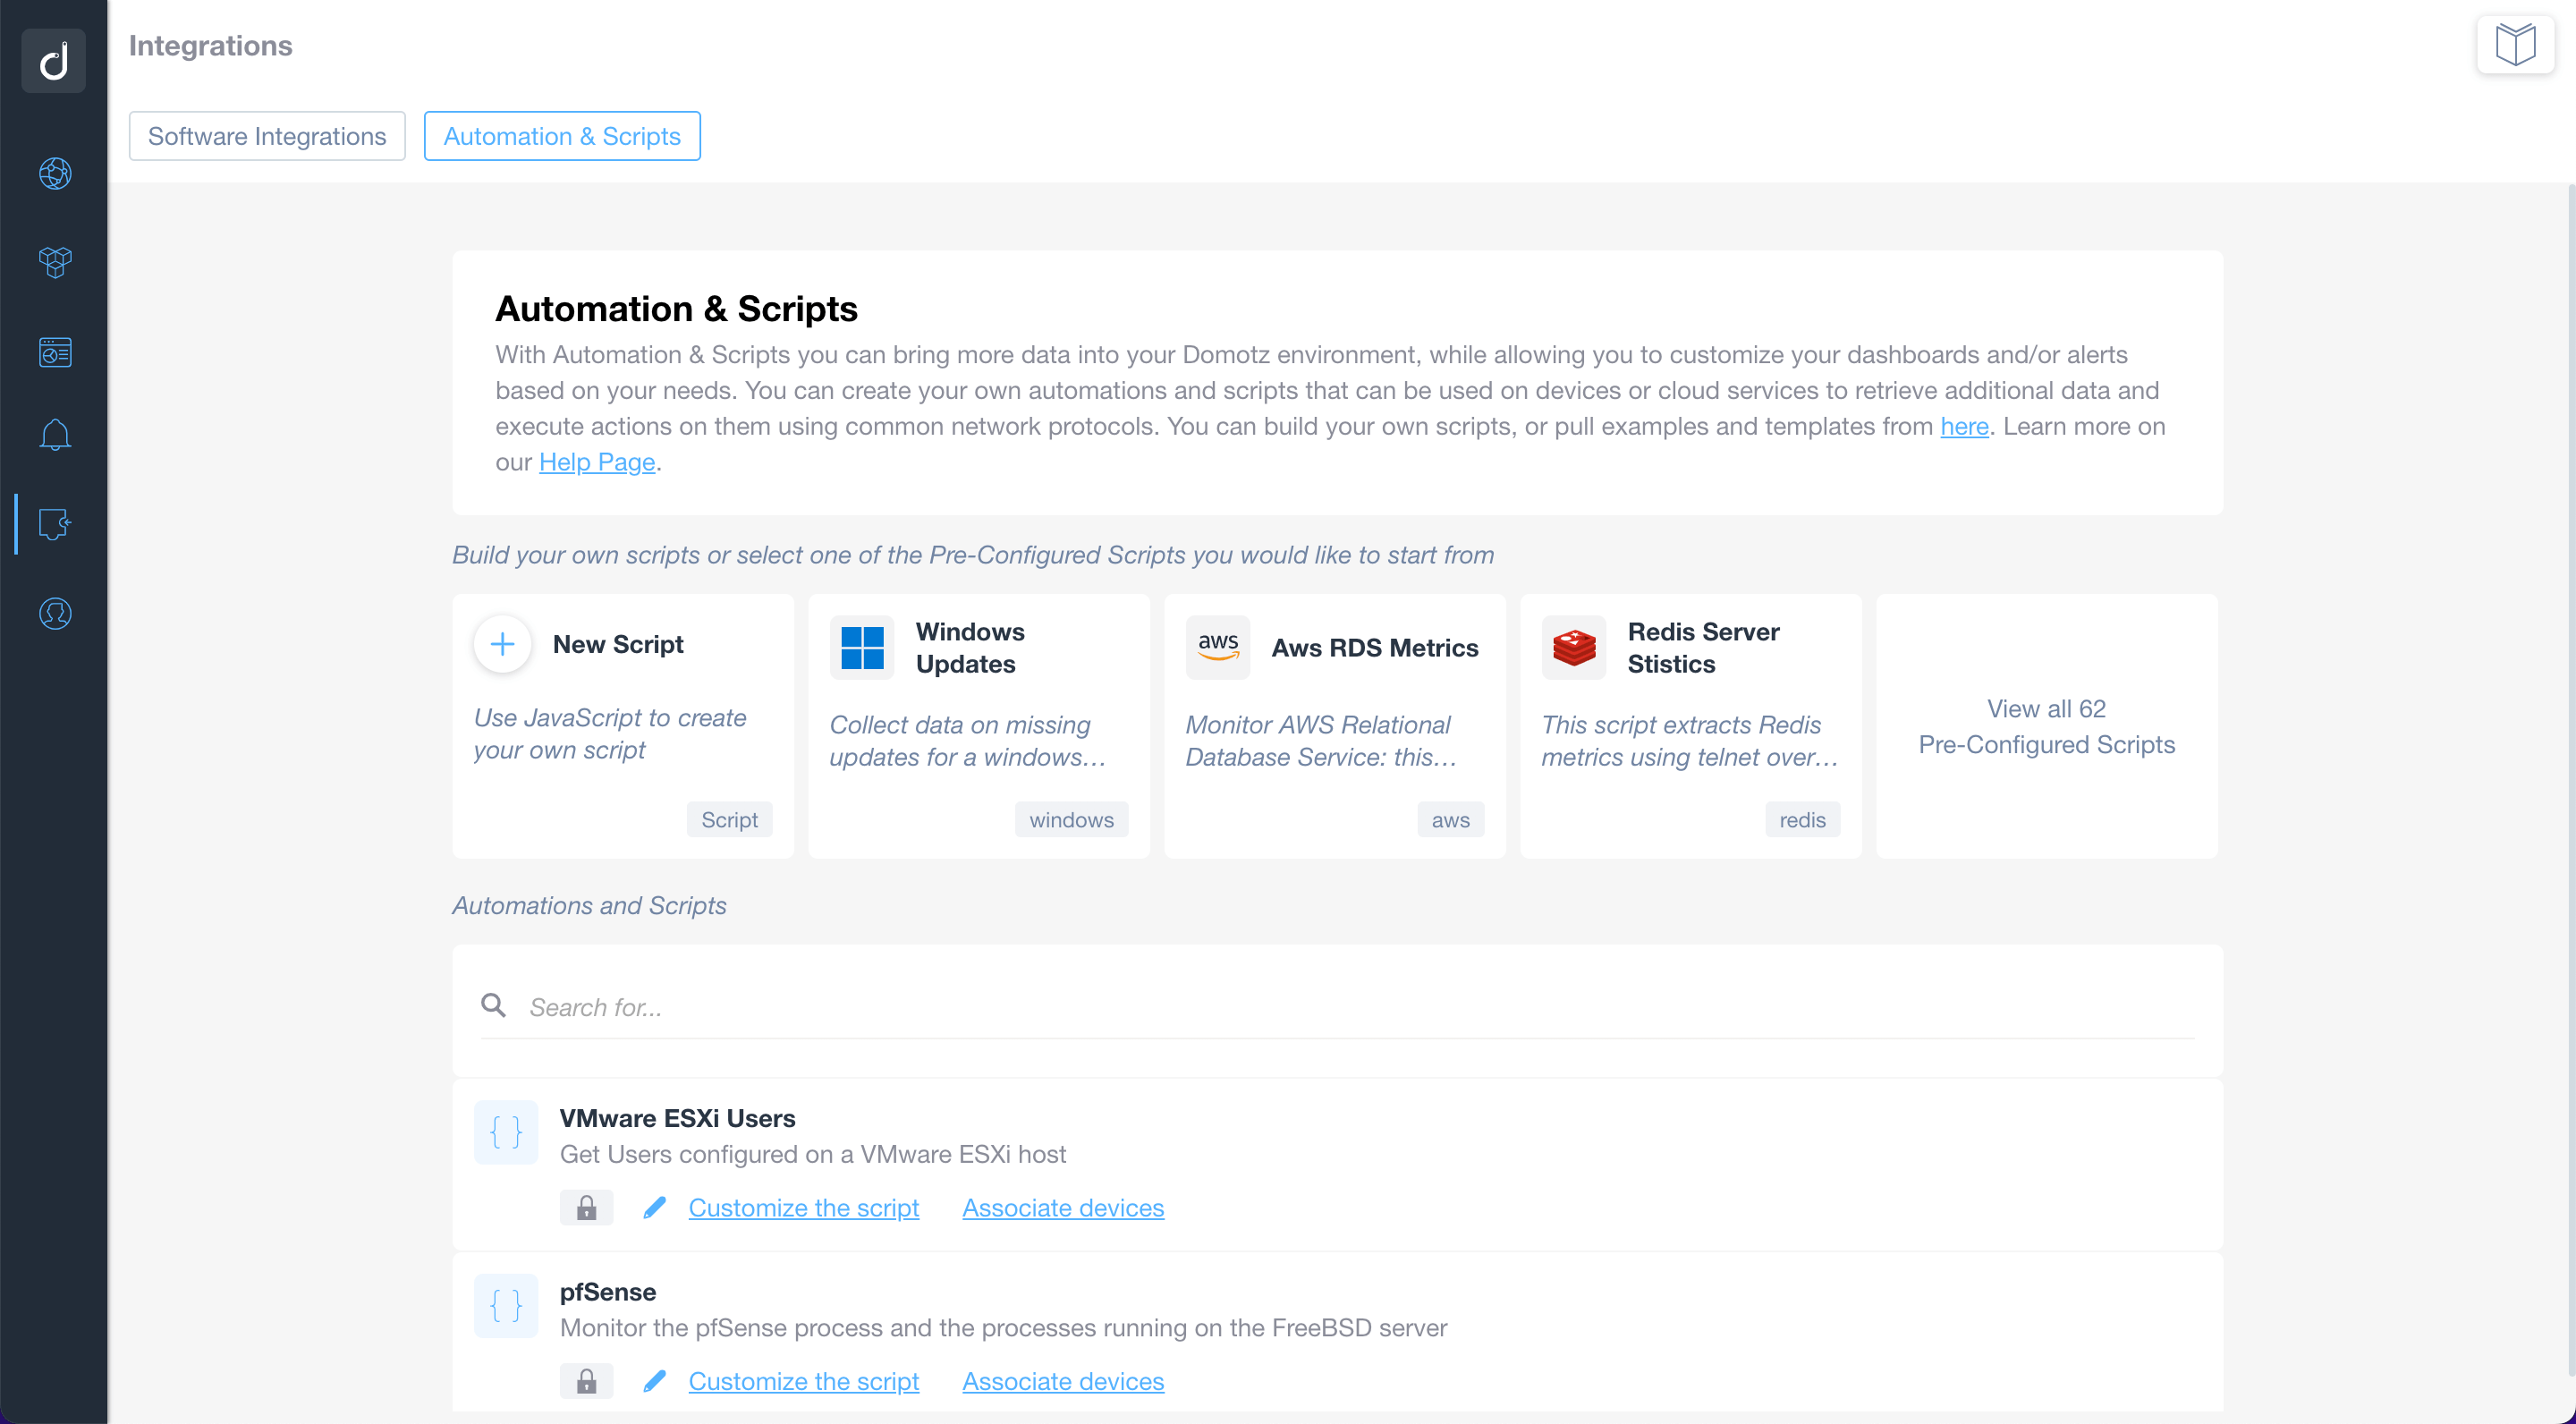
Use the pre-configured scripts to monitor and manage network-connected devices, cloud services, and web applications. By using standard network protocols, the scripts will allow you to retrieve valuable data and execute actions on the monitored devices and services.
Build or customize scripts according to your network monitoring needs.
Additionally, you can apply customized alerts on scripts to be notified when a specific event occurs.
Additional Resources:
Ready to Get Started?
- Uncover Network Blind Spots
- Resolve Issues Faster and Easier
- Exceed Service Delivery Expectations