Monitor pfSense and FreeBSD through Domotz
Now you can Monitor pfSense and FreeBSD through Domotz. pfSense is a firewall/router computer software distribution based on FreeBSD. The open-source pfSense Community Edition (CE) and pfSense Plus are installed on a physical computer or a virtual machine to make a dedicated firewall/router for a network.
Proactively monitor the gateway status as well as ingress/egress statistics. Review the rule configuration, daemon status, and interface status. Monitor the performance of processes and other capabilities offered by pfSense (and a generic FreeBSD script).

How to monitor pfSense and FreeBSD
Monitor your pfSense by using our custom scripts. It will allow you to monitor the pfSense process and the processes running on the FreeBSD server.
The scripts use different methodologies and protocols to access the FreeBSD and pfSense information:
- SSH
- SNMP
- HTTP/HTTPS
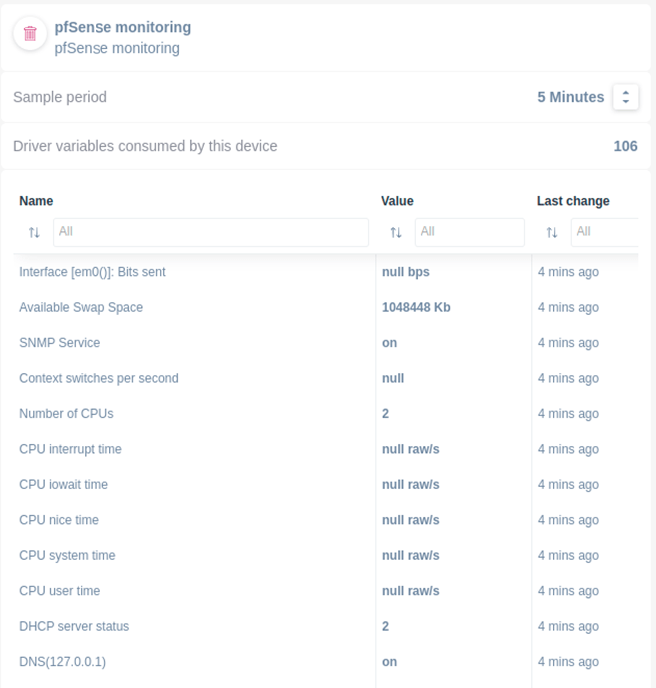
Our custom scripts offer a complete set of variables and stats that you can monitor through Domotz:
- pfsense.js - this is using SNMP
- pfsense_pfinfo.js - this is using HTTP
- pfsense_pftop.js - this is using SSH
- freebsd_top.js - this is using SSH
- freebsd_route.js - this is using SSH
The pfSense and FreeBSD custom scripts are in our examples library. Just customize them to fit your needs.
Monitor FreeBSD system configuration
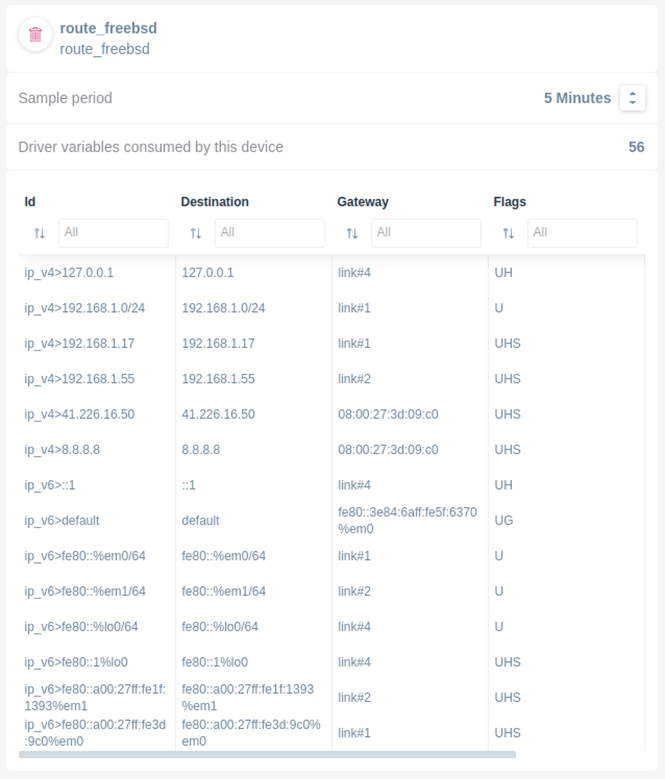
Review the routes as configured on your FreeBSD system. Reviewing the routes allows you to identify misconfigurations in your system.
Monitor pfSense system performance stats
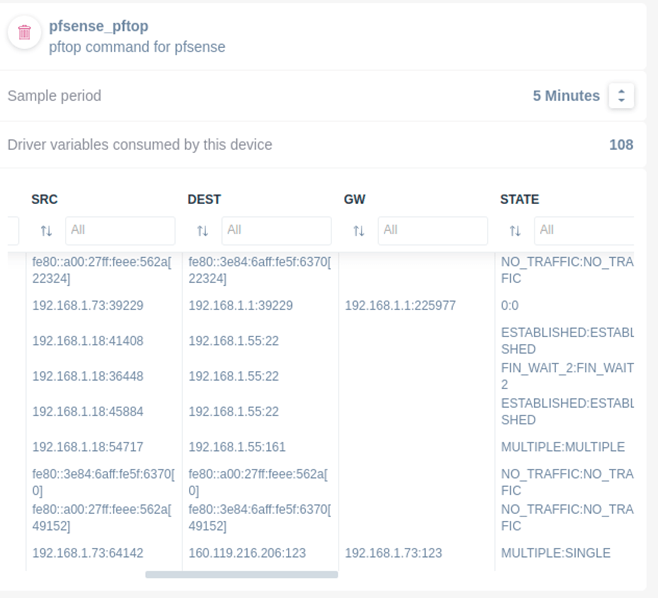
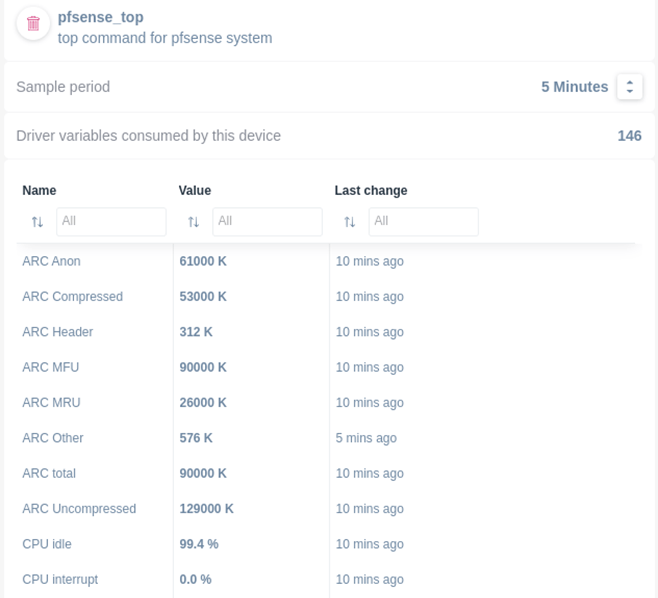
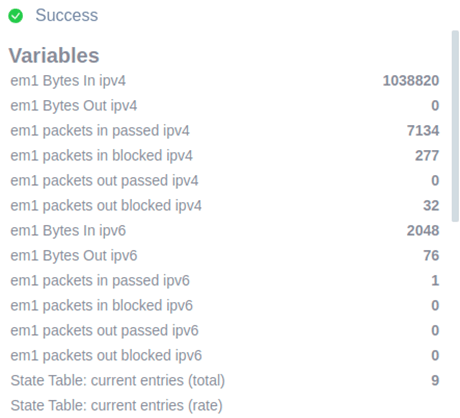
You can now extract basic and advanced performance metrics from your pfSense system.
You can monitor the top consumers and organize them by Source or Destination.
Or, you can review key statistics out of your pfSense system.
How to monitor pfSense firewall configuration management
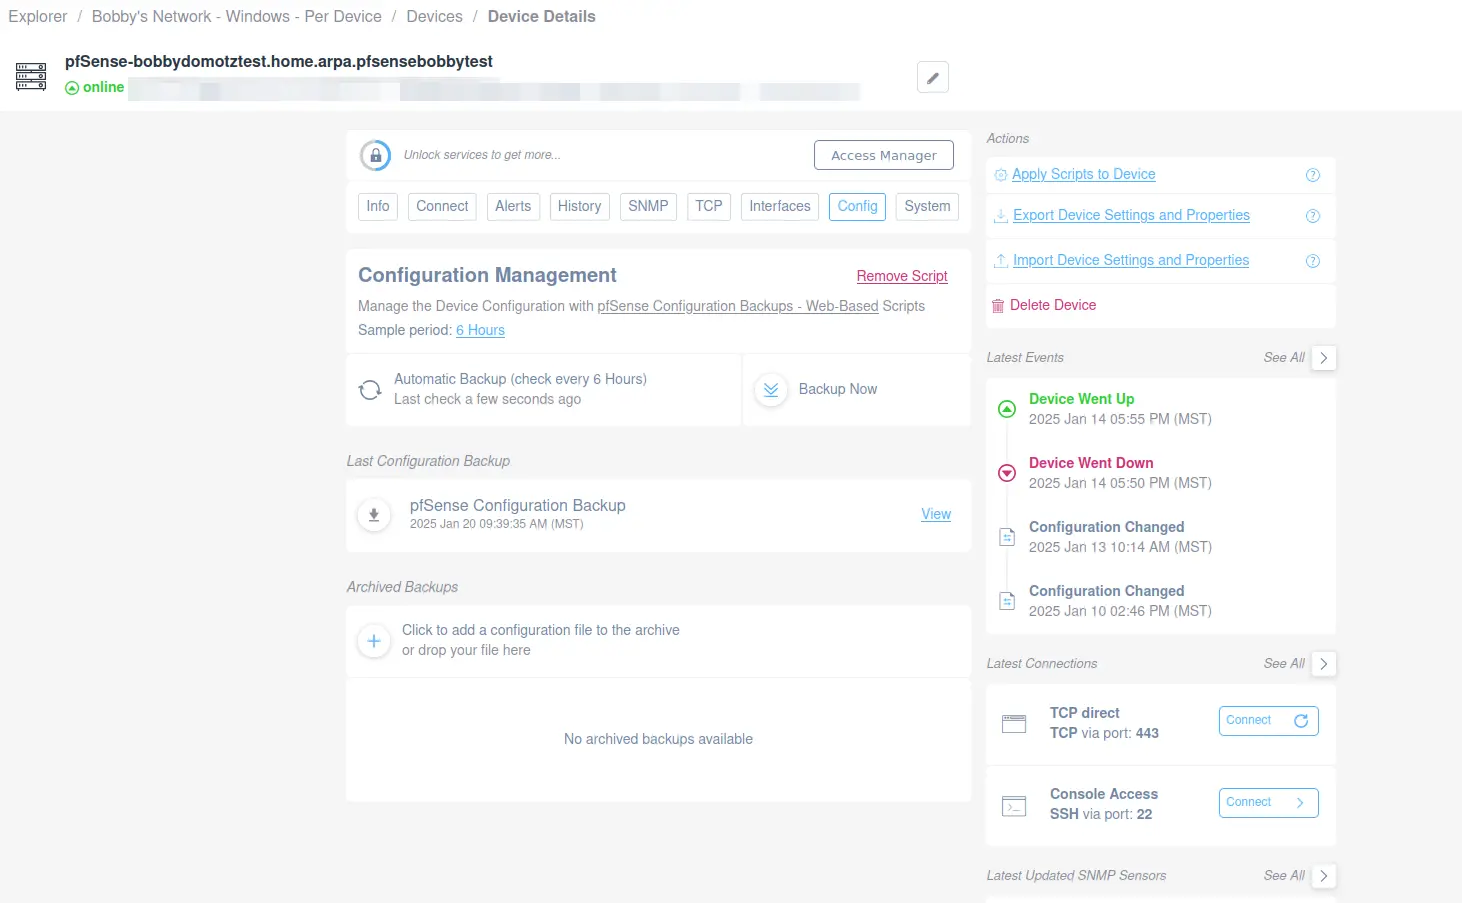
Backing up the configuration of your pfSense Firewall has never been so easy. Apply this specific script to prevent information loss.
Please note that the script uses HTTPS protocol and has been validated and tested on pfSense Firewall 2.7.2
Quickly open our library and choose the custom script that fits your needs.
Additional Resources:
Ready to Get Started?
- Uncover Network Blind Spots
- Resolve Issues Faster and Easier
- Exceed Service Delivery Expectations