
Monitor RabbitMQ clusters and nodes through Domotz
RabbitMQ cluster and nodes monitoring is available through Domotz network monitoring software.
RabbitMQ is an open-source message-broker software that originally implemented the Advanced Message Queuing Protocol (AMQP) and has since been extended with a plug-in architecture to support Streaming Text Oriented Messaging Protocol (STOMP), MQ Telemetry Transport (MQTT), and other protocols.
RabbitMQ is used to manage communication between applications, databases, and devices.
Keep an eye on the performance of the complex RabbitMQ systems with Domotz custom scripts.
We enable you to proactively monitor RabbitMQ performance and instances (single nodes or clusters) through Domotz.

How to monitor RabbitMQ
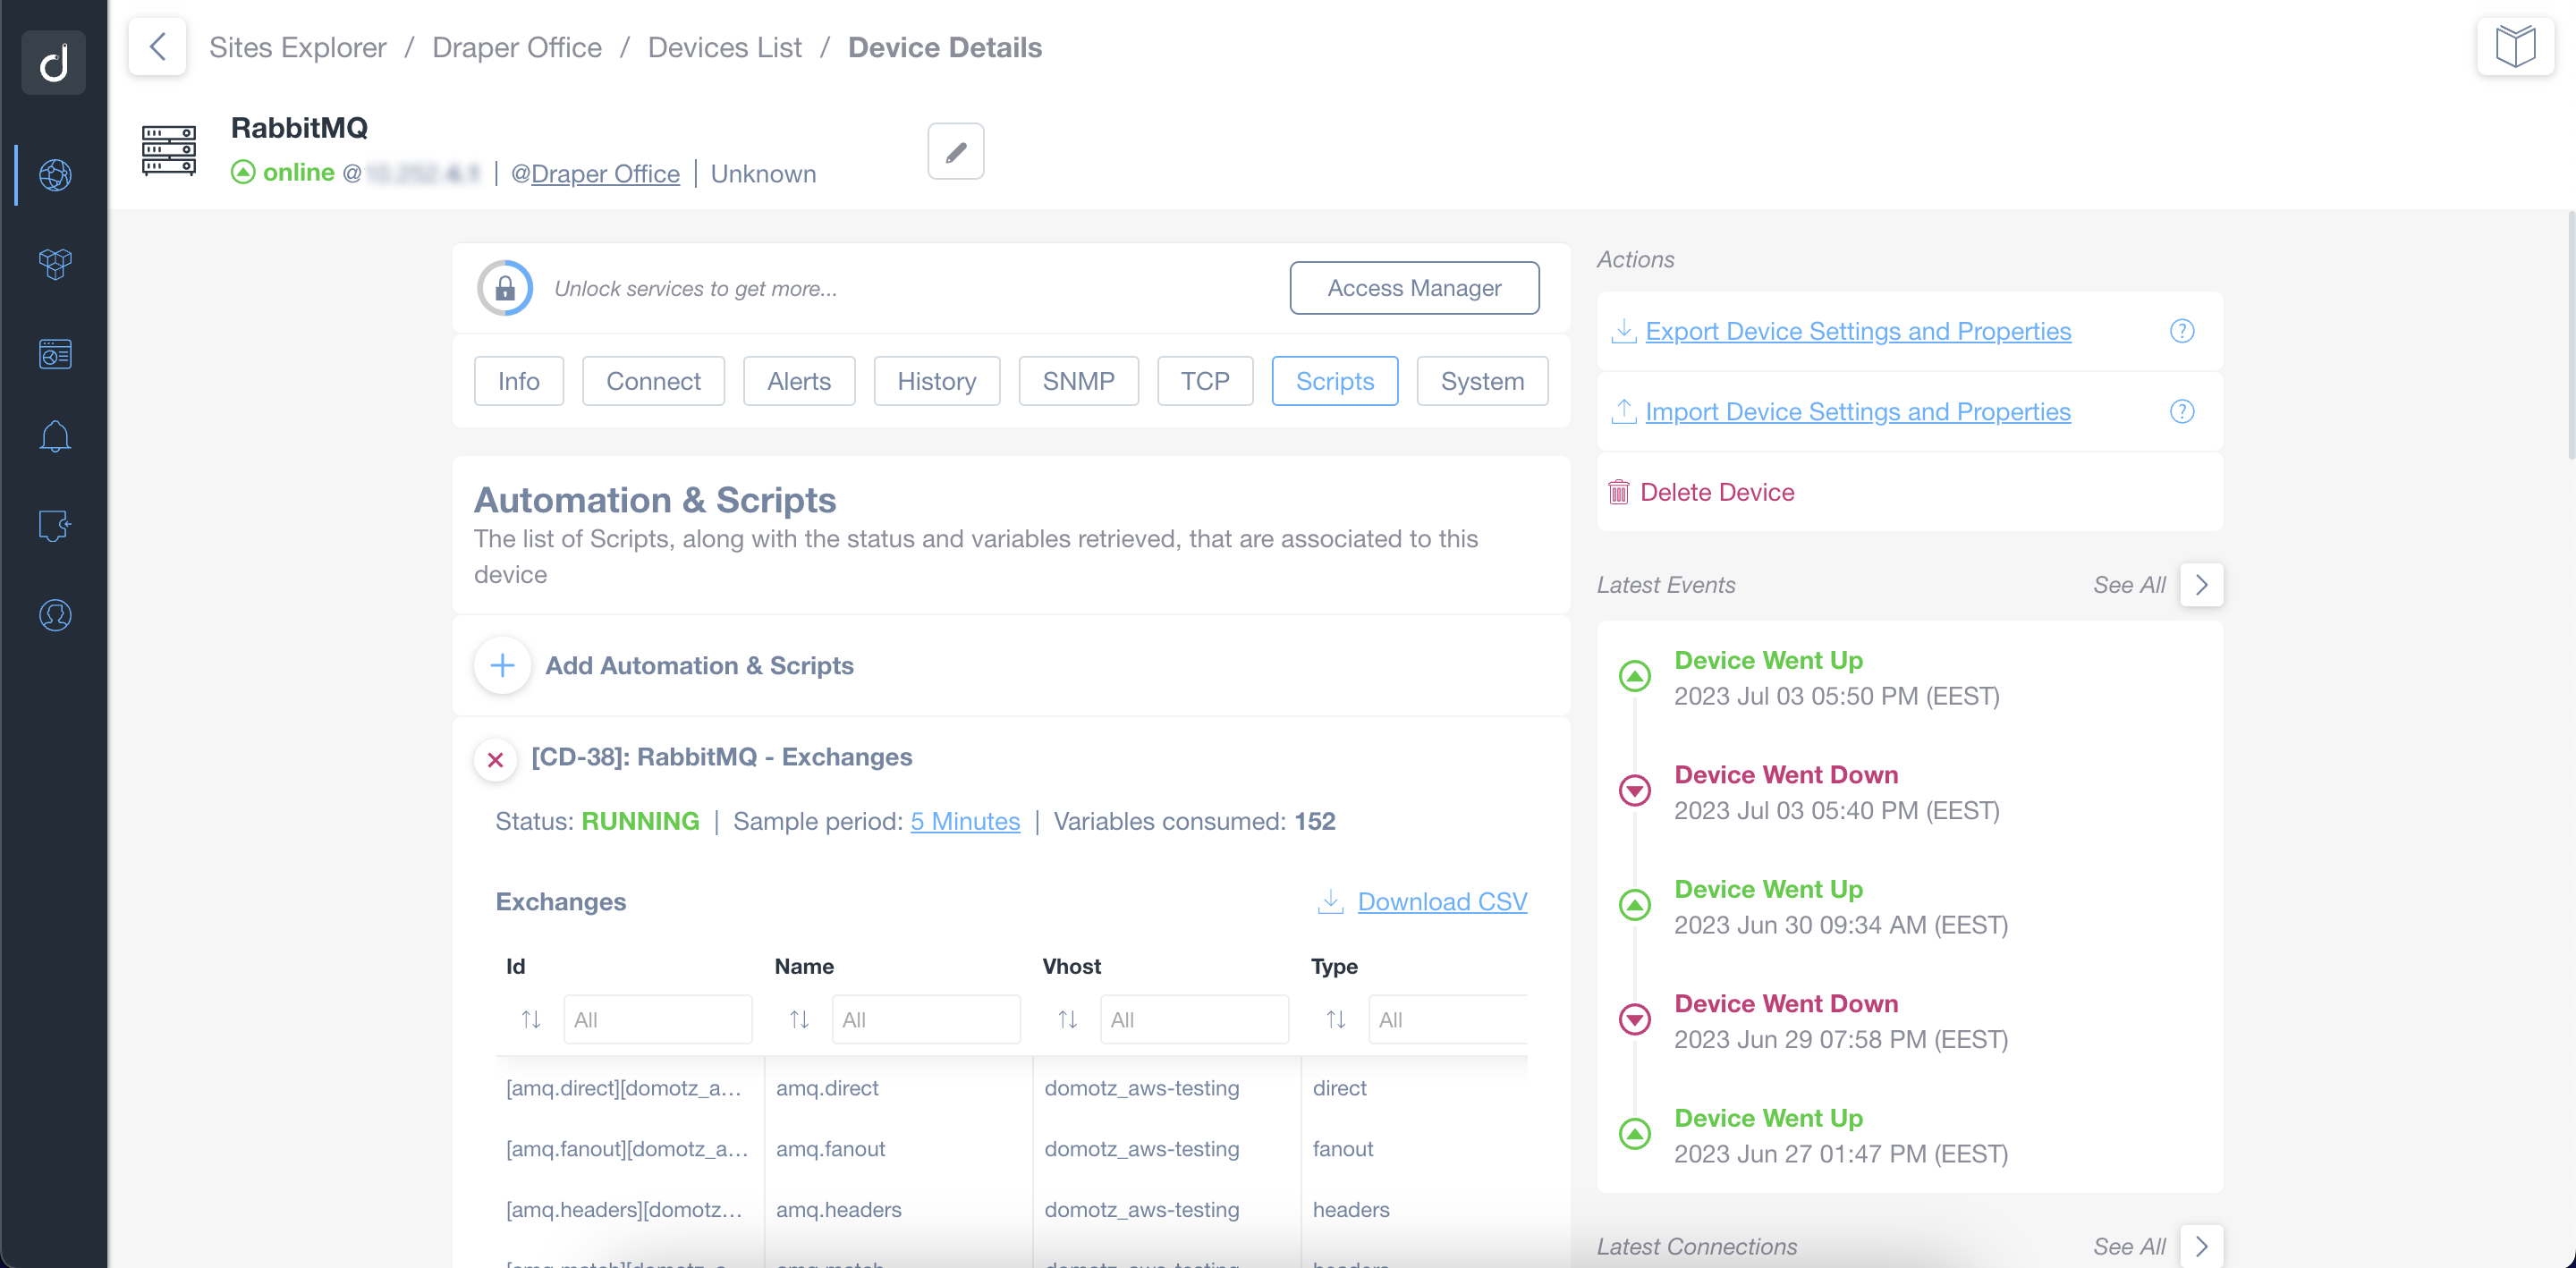
Monitor RabbitMQ clusters and nodes using our custom scripts.
The scripts use the HTTP-based API to access the RabbitMQ information. A set of credentials (Username and Password) is required to access the information.
Three different custom scripts have been developed to offer an initial set of variables and stats that can be monitored through Domotz:
- rabbitmq_system.js - this script dynamically creates system metrics for the RabbitMQ Nodes and Clusters
- rabbitmq_exchanges.js - this script dynamically creates a table with parameters and statistics for all the exchanges discovered on the RabbitMQ instances
- rabbitmq_queues.js - this script dynamically creates a table with parameters and statistics for all the queues discovered on the RabbitMQ instances
You can find the RabbitMQ custom scripts in our examples library. Just customize them to fit your needs.
Easily Monitor the Nodes and Clusters configured in your RabbitMQ instances
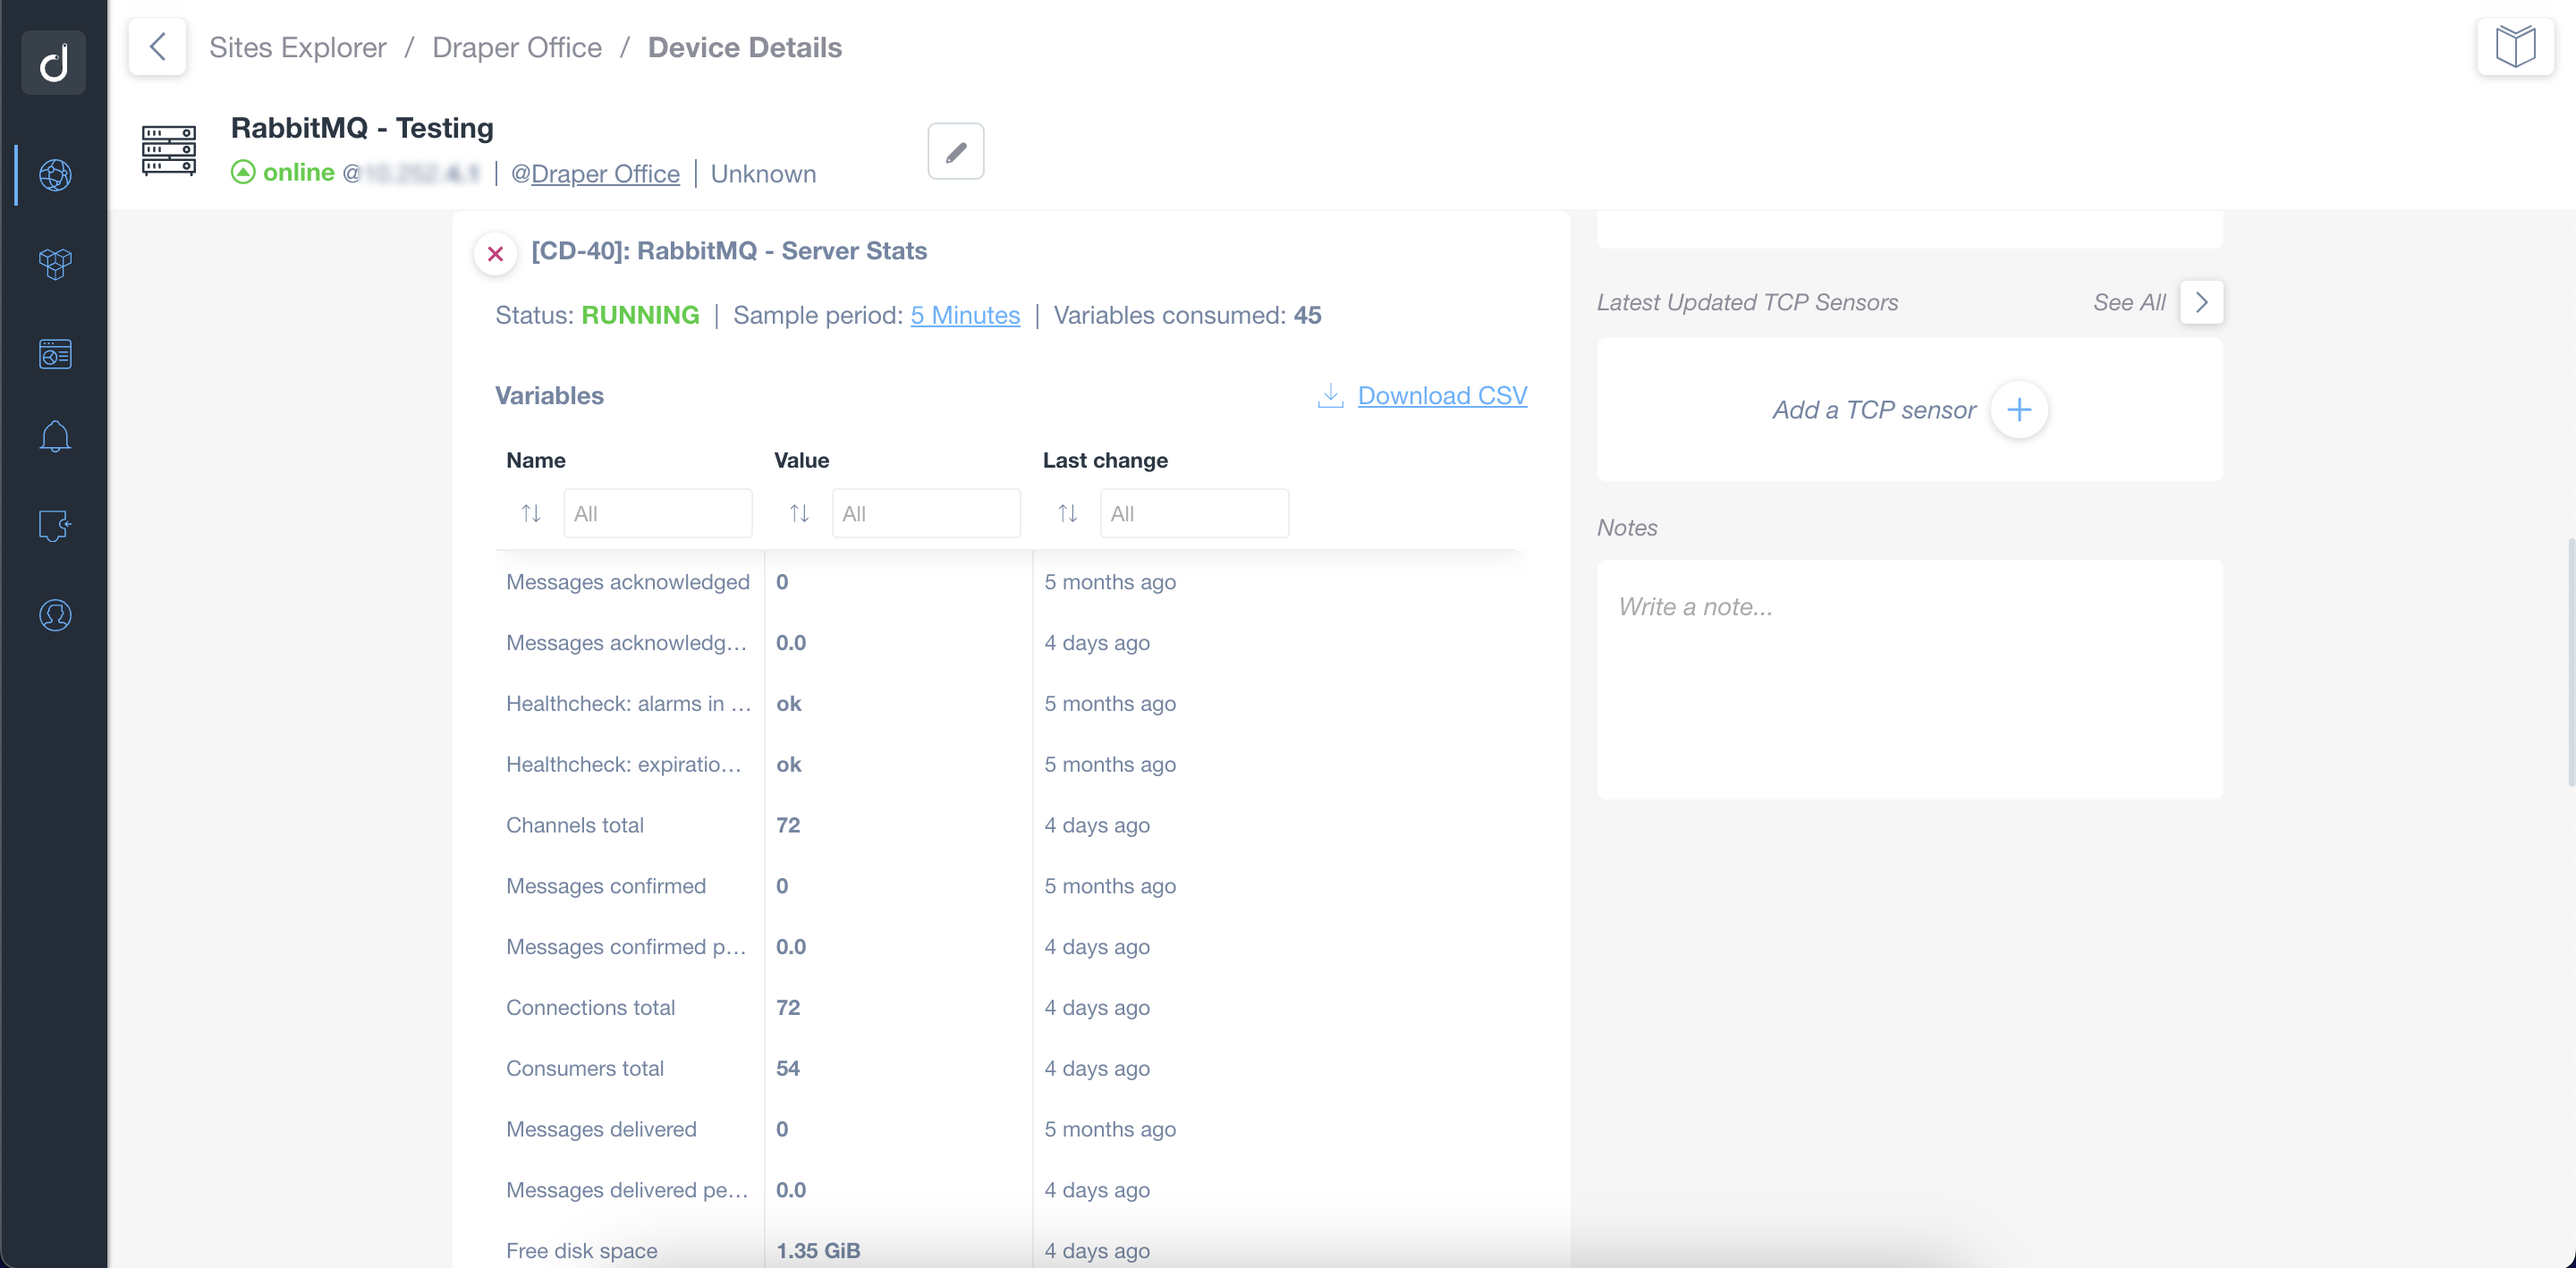
For each Node/Cluster, correctly identify its configuration. Check the limits and adjust them accordingly:
- Health check Parameters
- Sockets Available (and used ones)
- Memory limits (and used one)
- File descriptors limits (and used ones)
- Etc
Monitor the performance stats and info for each of the Exchanges configured
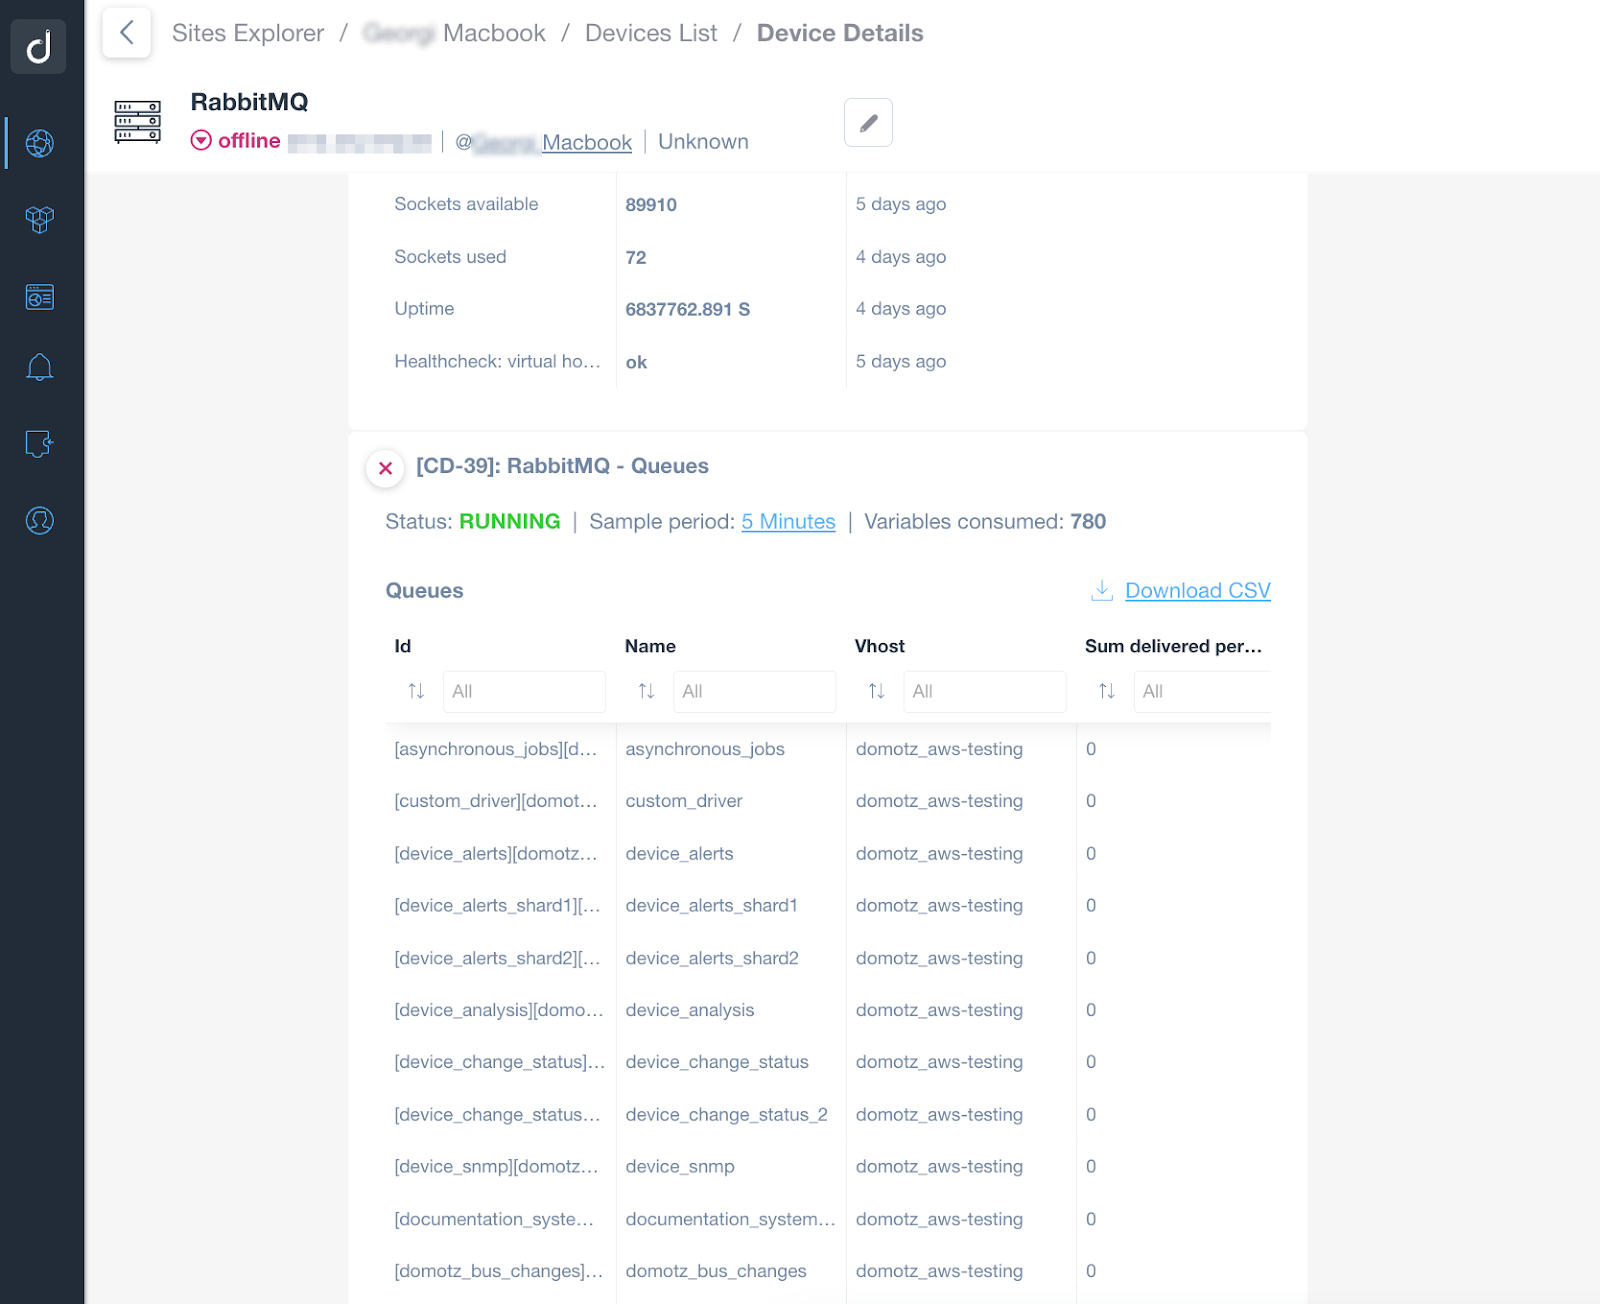
For each configured Exchange, measure and monitor the health check parameters, such as:
- Vhosts of the Exchange
- Type of the Exchange
- Messages (Acknowledged, Confirmed, Published, etc)
- Number of messages managed per second
- And more
Monitor the performance stats and info for each of the Queue configured
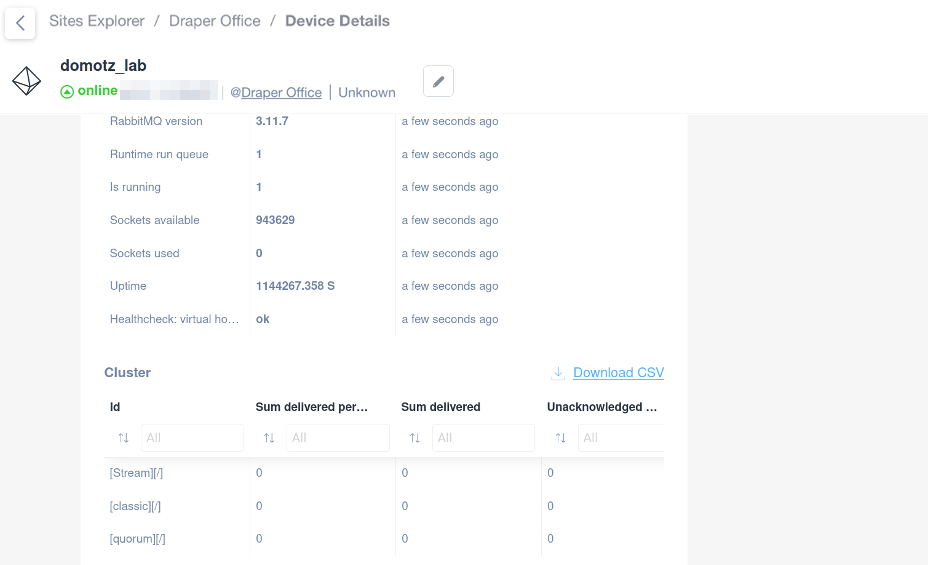
For each configured Queue, measure and monitor the health check parameters, such as:
- Vhosts of the Queue
- Type of the Queue
- Messages (Acknowledged, Confirmed, Published, etc)
- Number of messages managed per second
- Number of Consumers
- Memory consumed for the specific Queue
- And more
Full network visibility with ready-to-use scripts
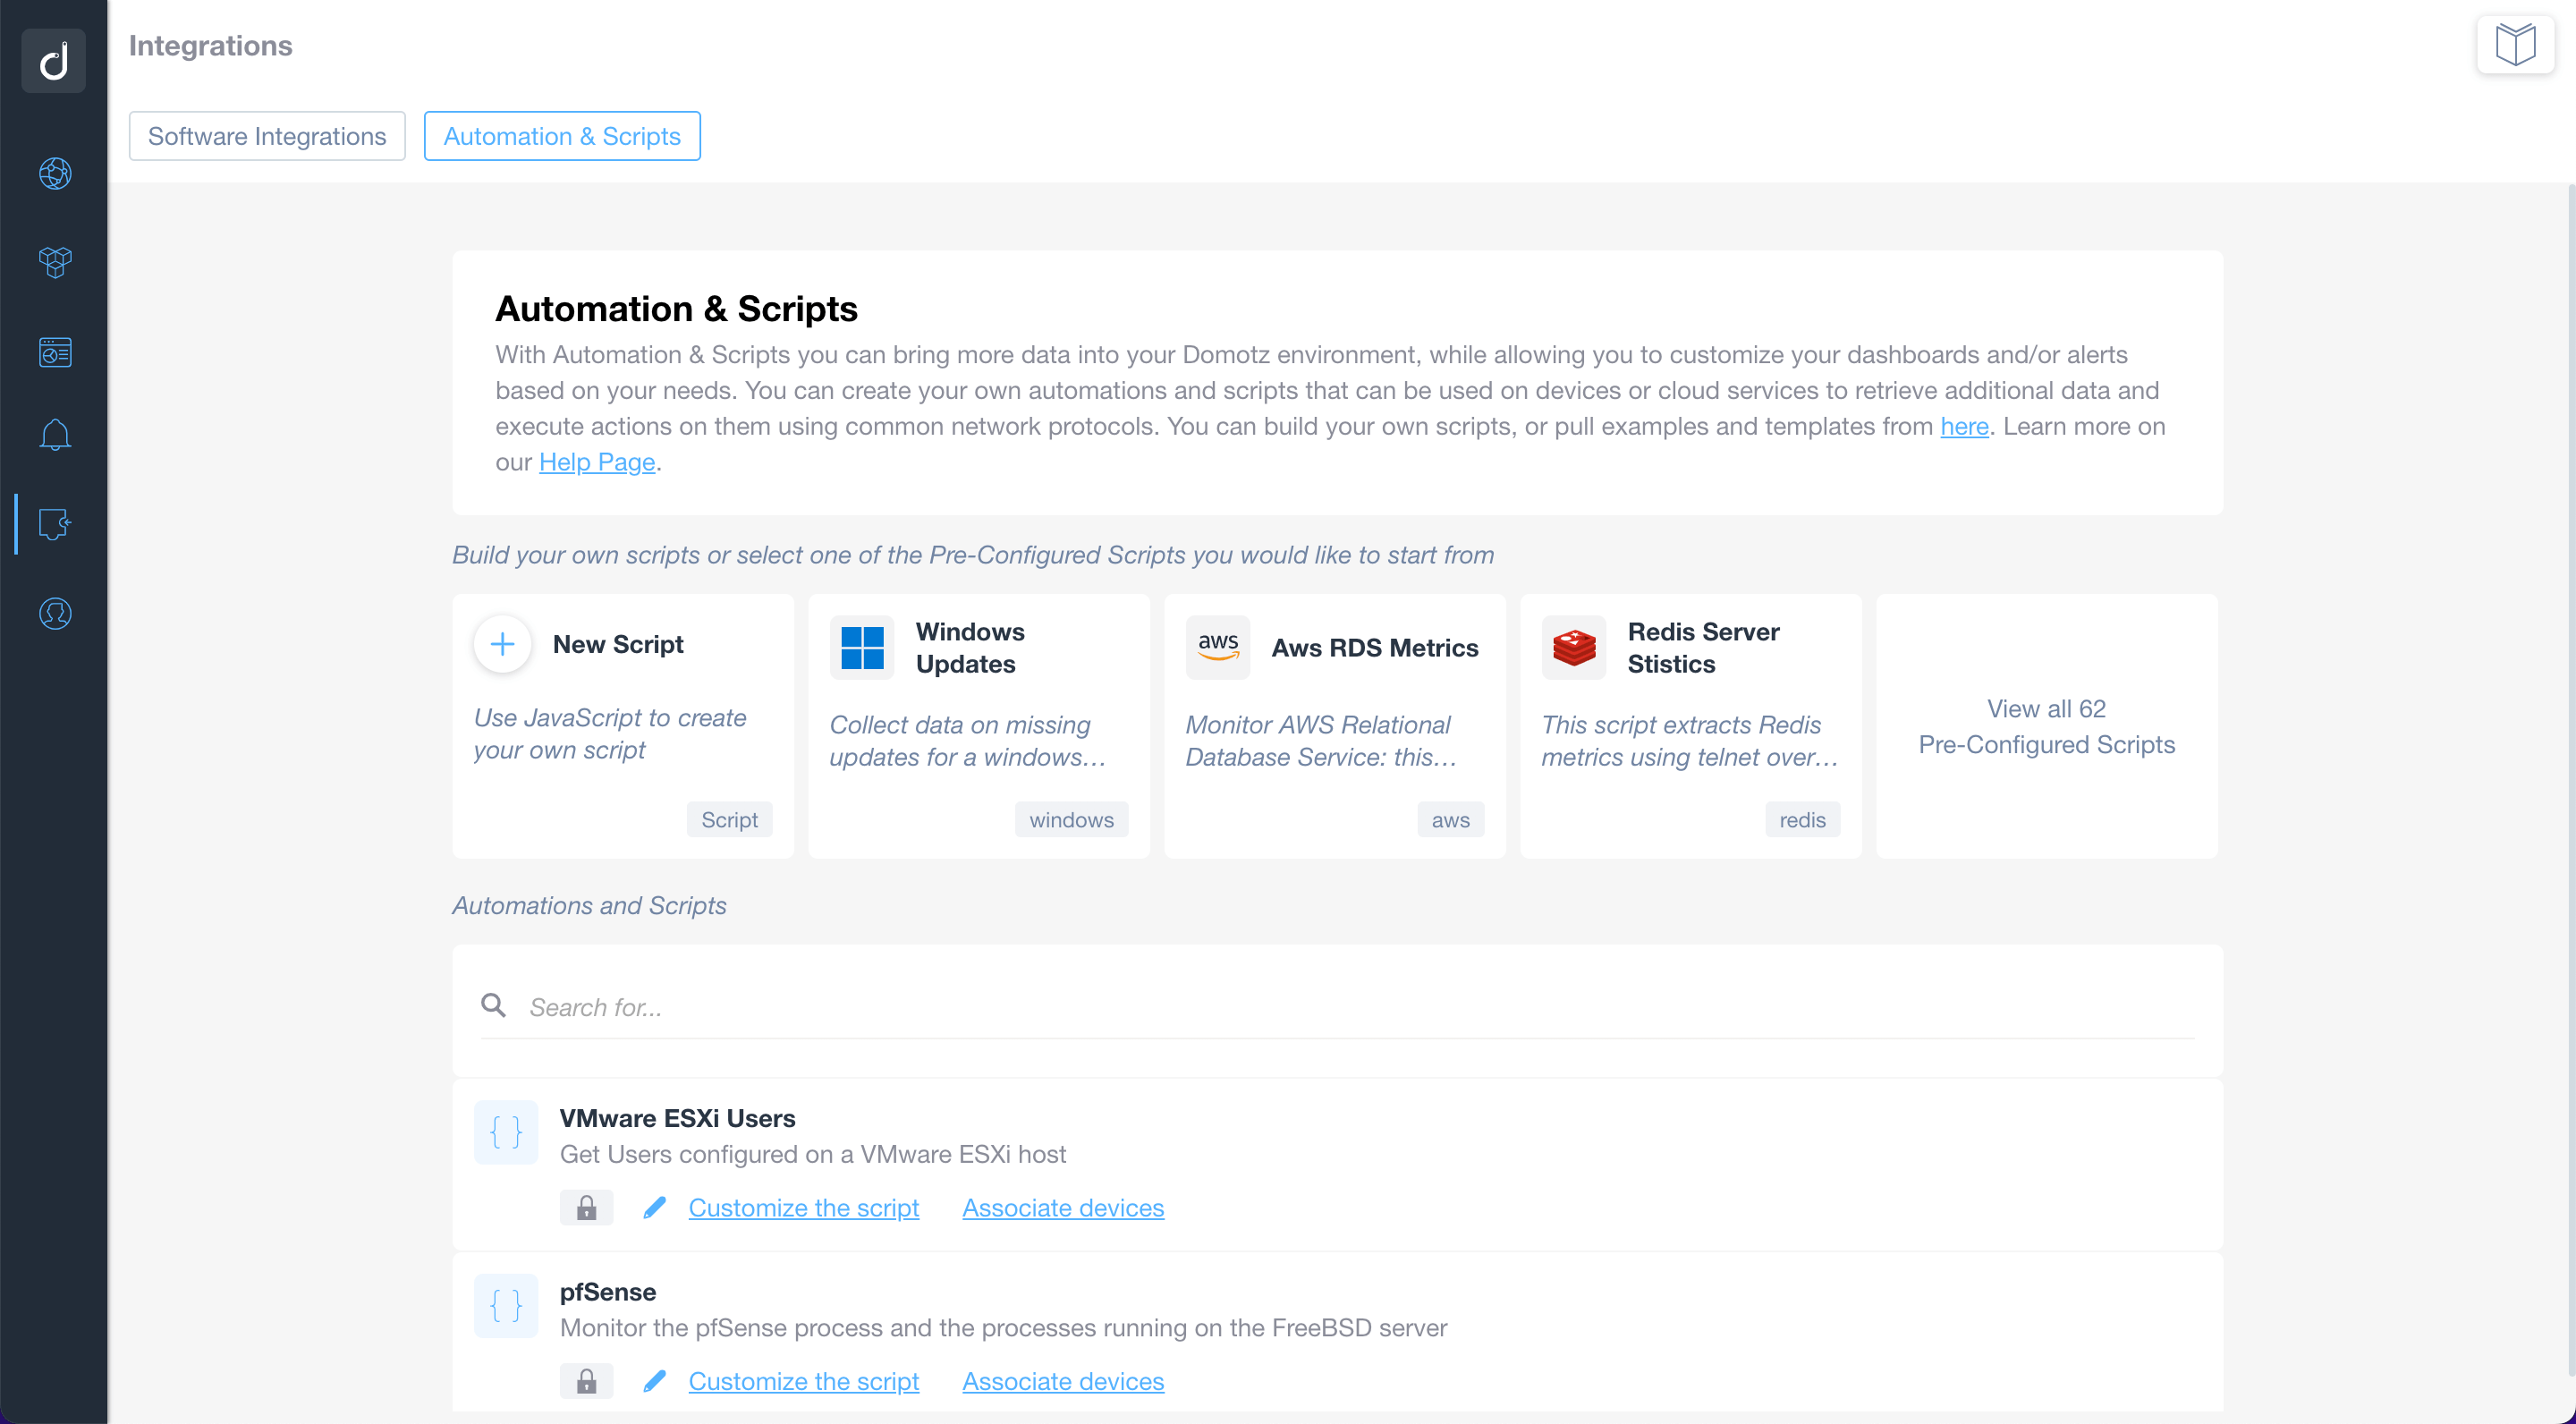
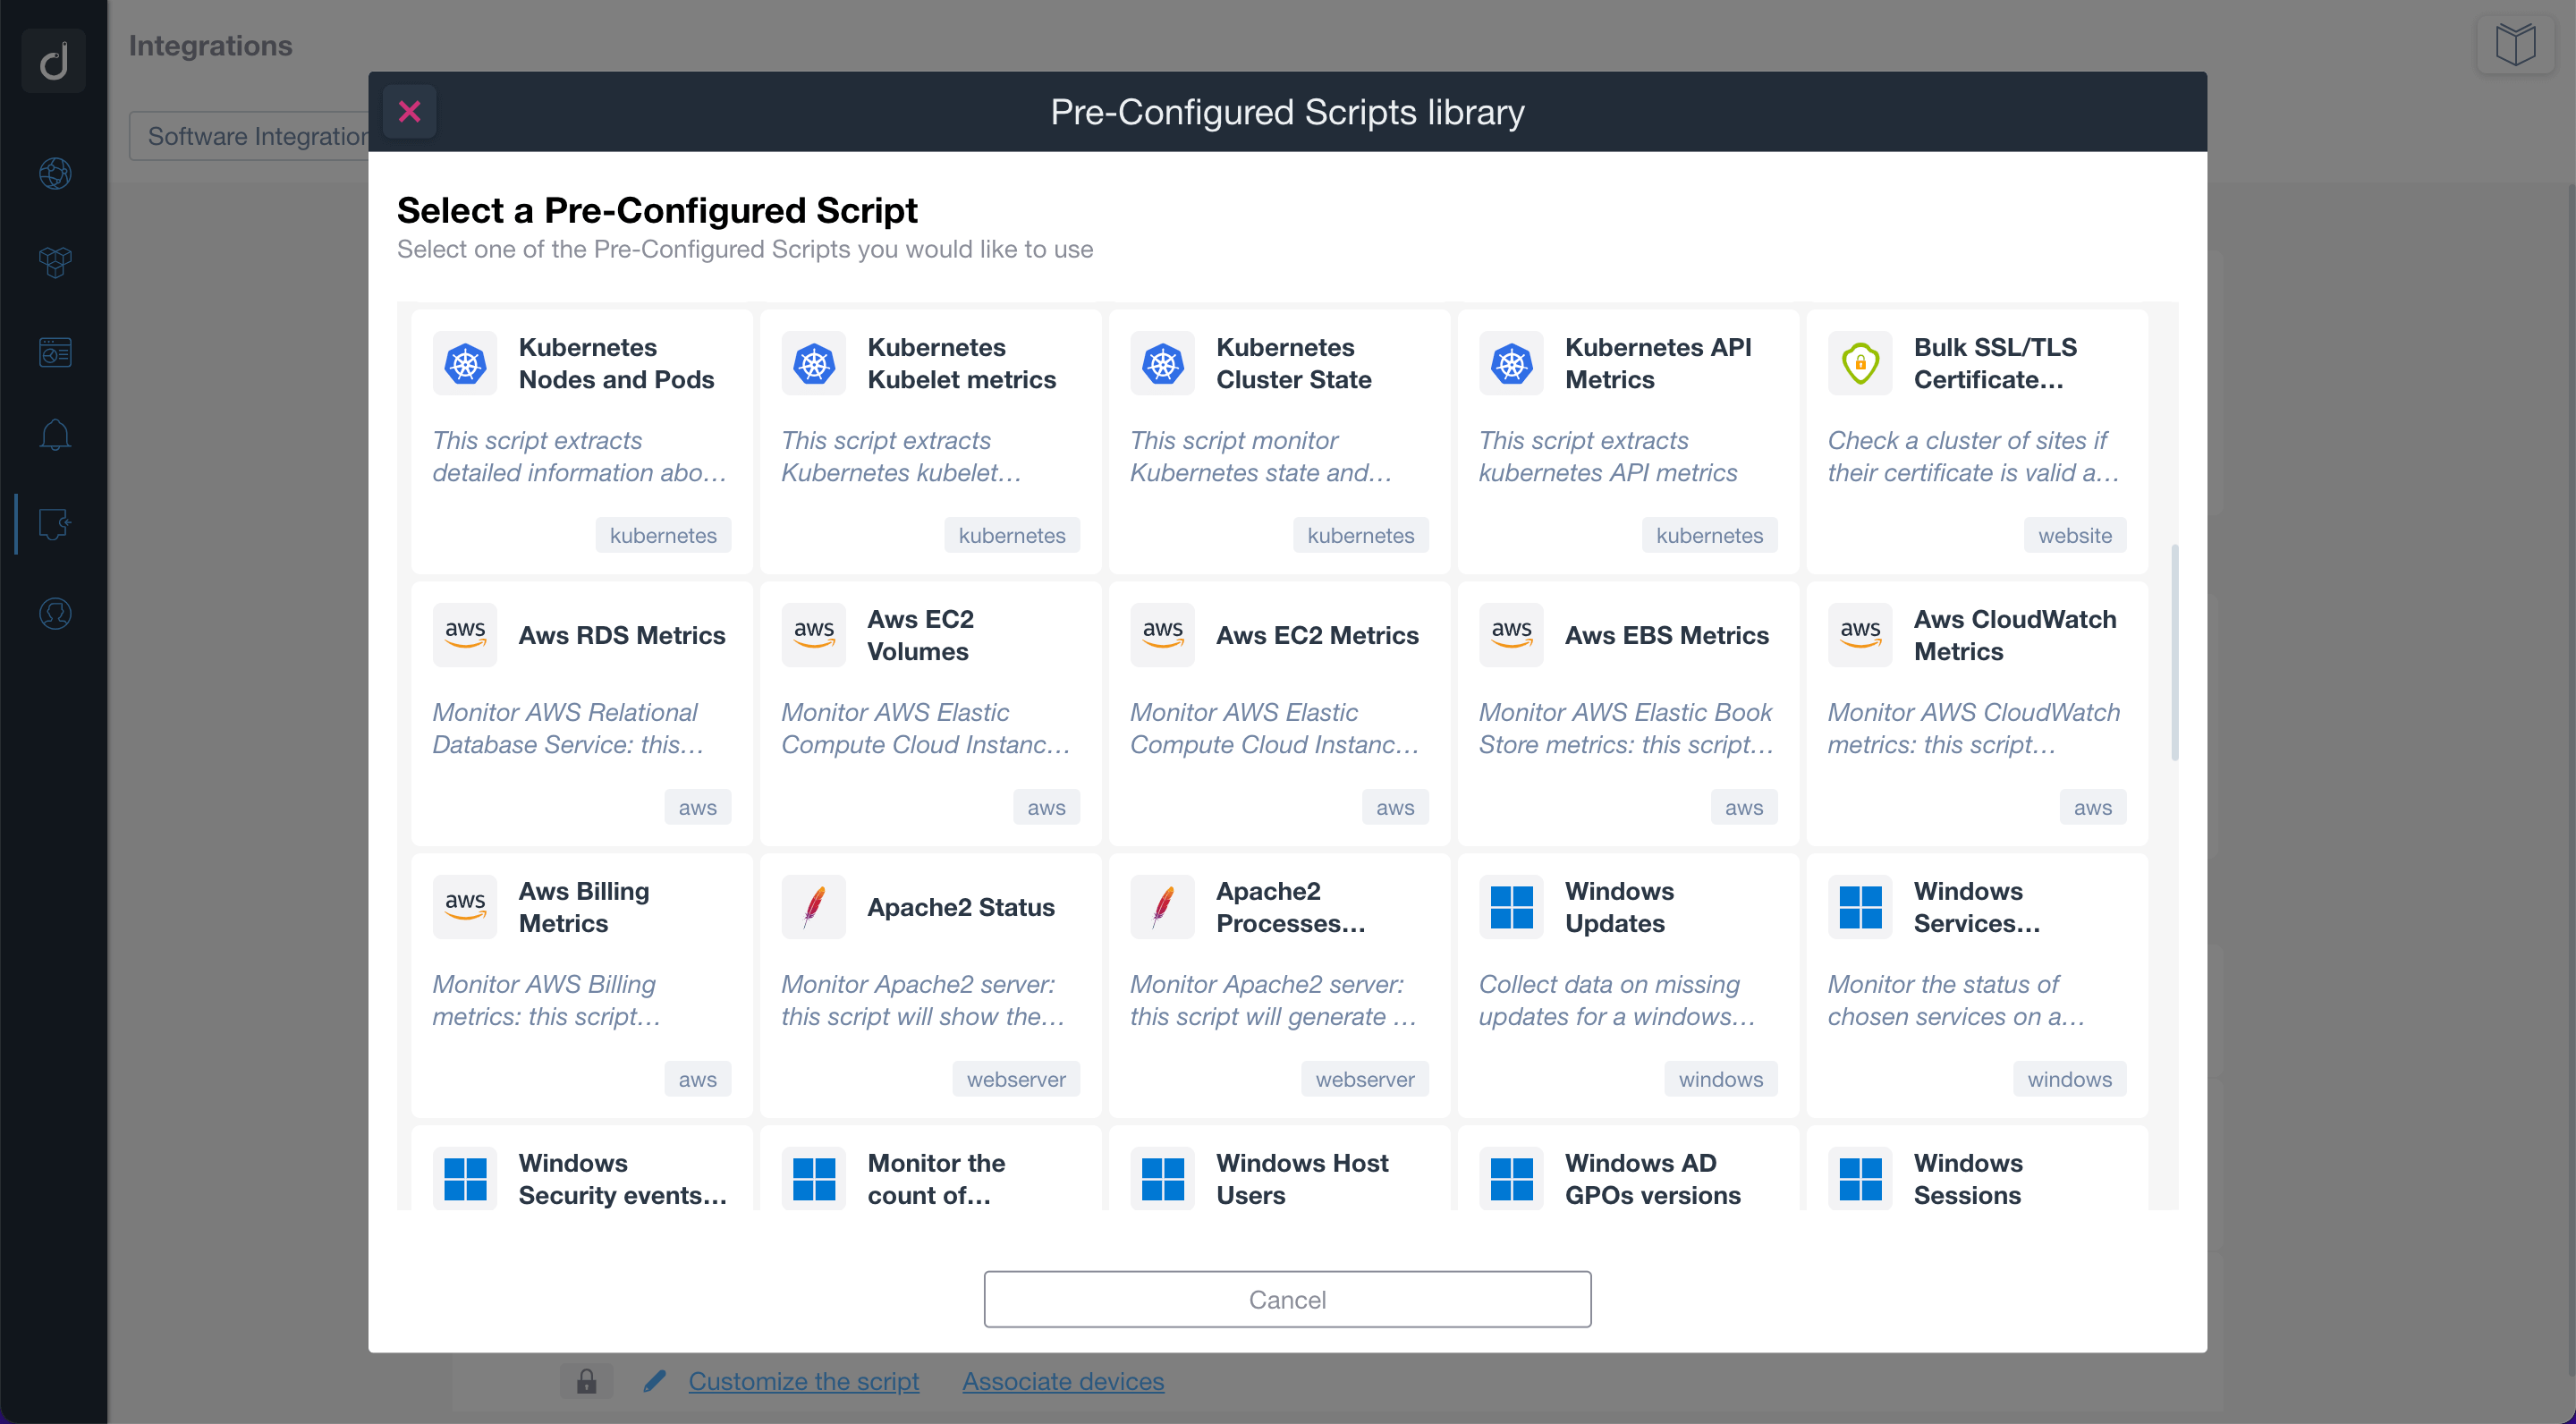
Use the pre-configured scripts to monitor and manage network-connected devices, cloud services, and web applications. By using standard network protocols, the scripts will allow you to retrieve valuable data and execute actions on the monitored devices and services.
Build or customize scripts according to your network monitoring needs.
Additionally, you can apply customized alerts on scripts to be notified when a specific event occurs.

