Redis Monitoring
Our Redis Monitoring helps you manage your Redis system through Domotz. Redis is an in-memory data structure store used as a distributed, in-memory key-value database, cache, and message broker, with optional durability. Redis supports different kinds of abstract data structures, such as strings, lists, maps, sets, sorted sets, HyperLogLogs, bitmaps, streams, and spatial indexes. (cit. Wikipedia)
We offer proactive Redis monitoring by extracting information like configuration, resource consumption (memory, CPU, etc.), cluster definition, replication statistics, connected client information, and more.

How to monitor Redis
Monitor your Redis by using our custom scripts. You’ll be able to monitor your Redis process on your server.
The scripts use Telnet to connect to the Redis instance over the Redis port (default 6379) and extract the required information.
Several different custom scripts have been developed for our Redis Monitoring to offer a complete set of variables and stats you can monitor through Domotz:
- redis.js - for a basic list of variables extracted from the Redis system, such as server info, clients, memory, persistence, CPU, etc., all in the form of single variables.
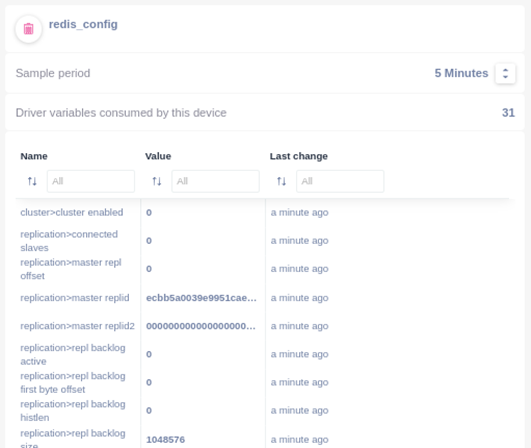
- redis_config.js - to extract the Redis configuration table, such as Server Info (like General information about the Redis server), replication configuration, cluster configuration, and keyspace.
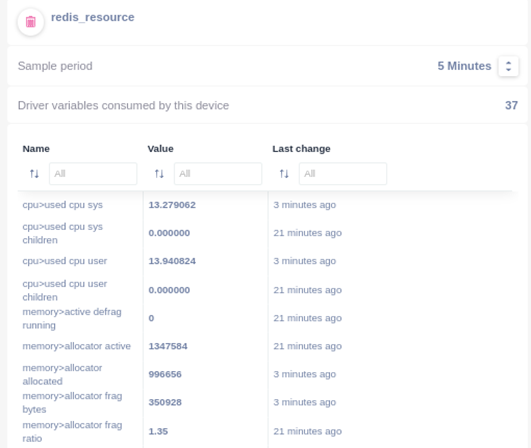
- redis_resource.js - to extract the Redis resource consumption monitoring, such as CPU consumption and Memory usage.
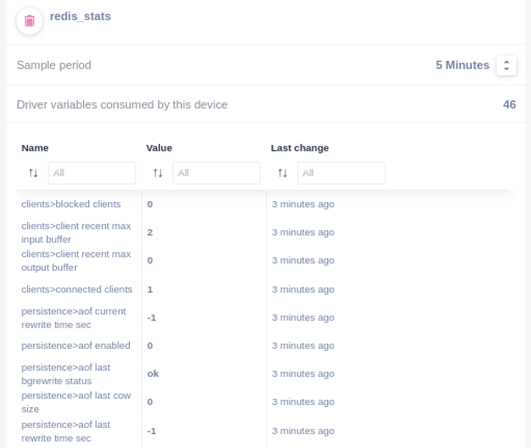
- redis_stats.js - to extract the Redis statistics, such as client connected, persistence info, and generic statistics.
You can find the Redis monitoring driver codes in our examples library. Just customize them to fit your needs.
Full network visibility with ready-to-use scripts
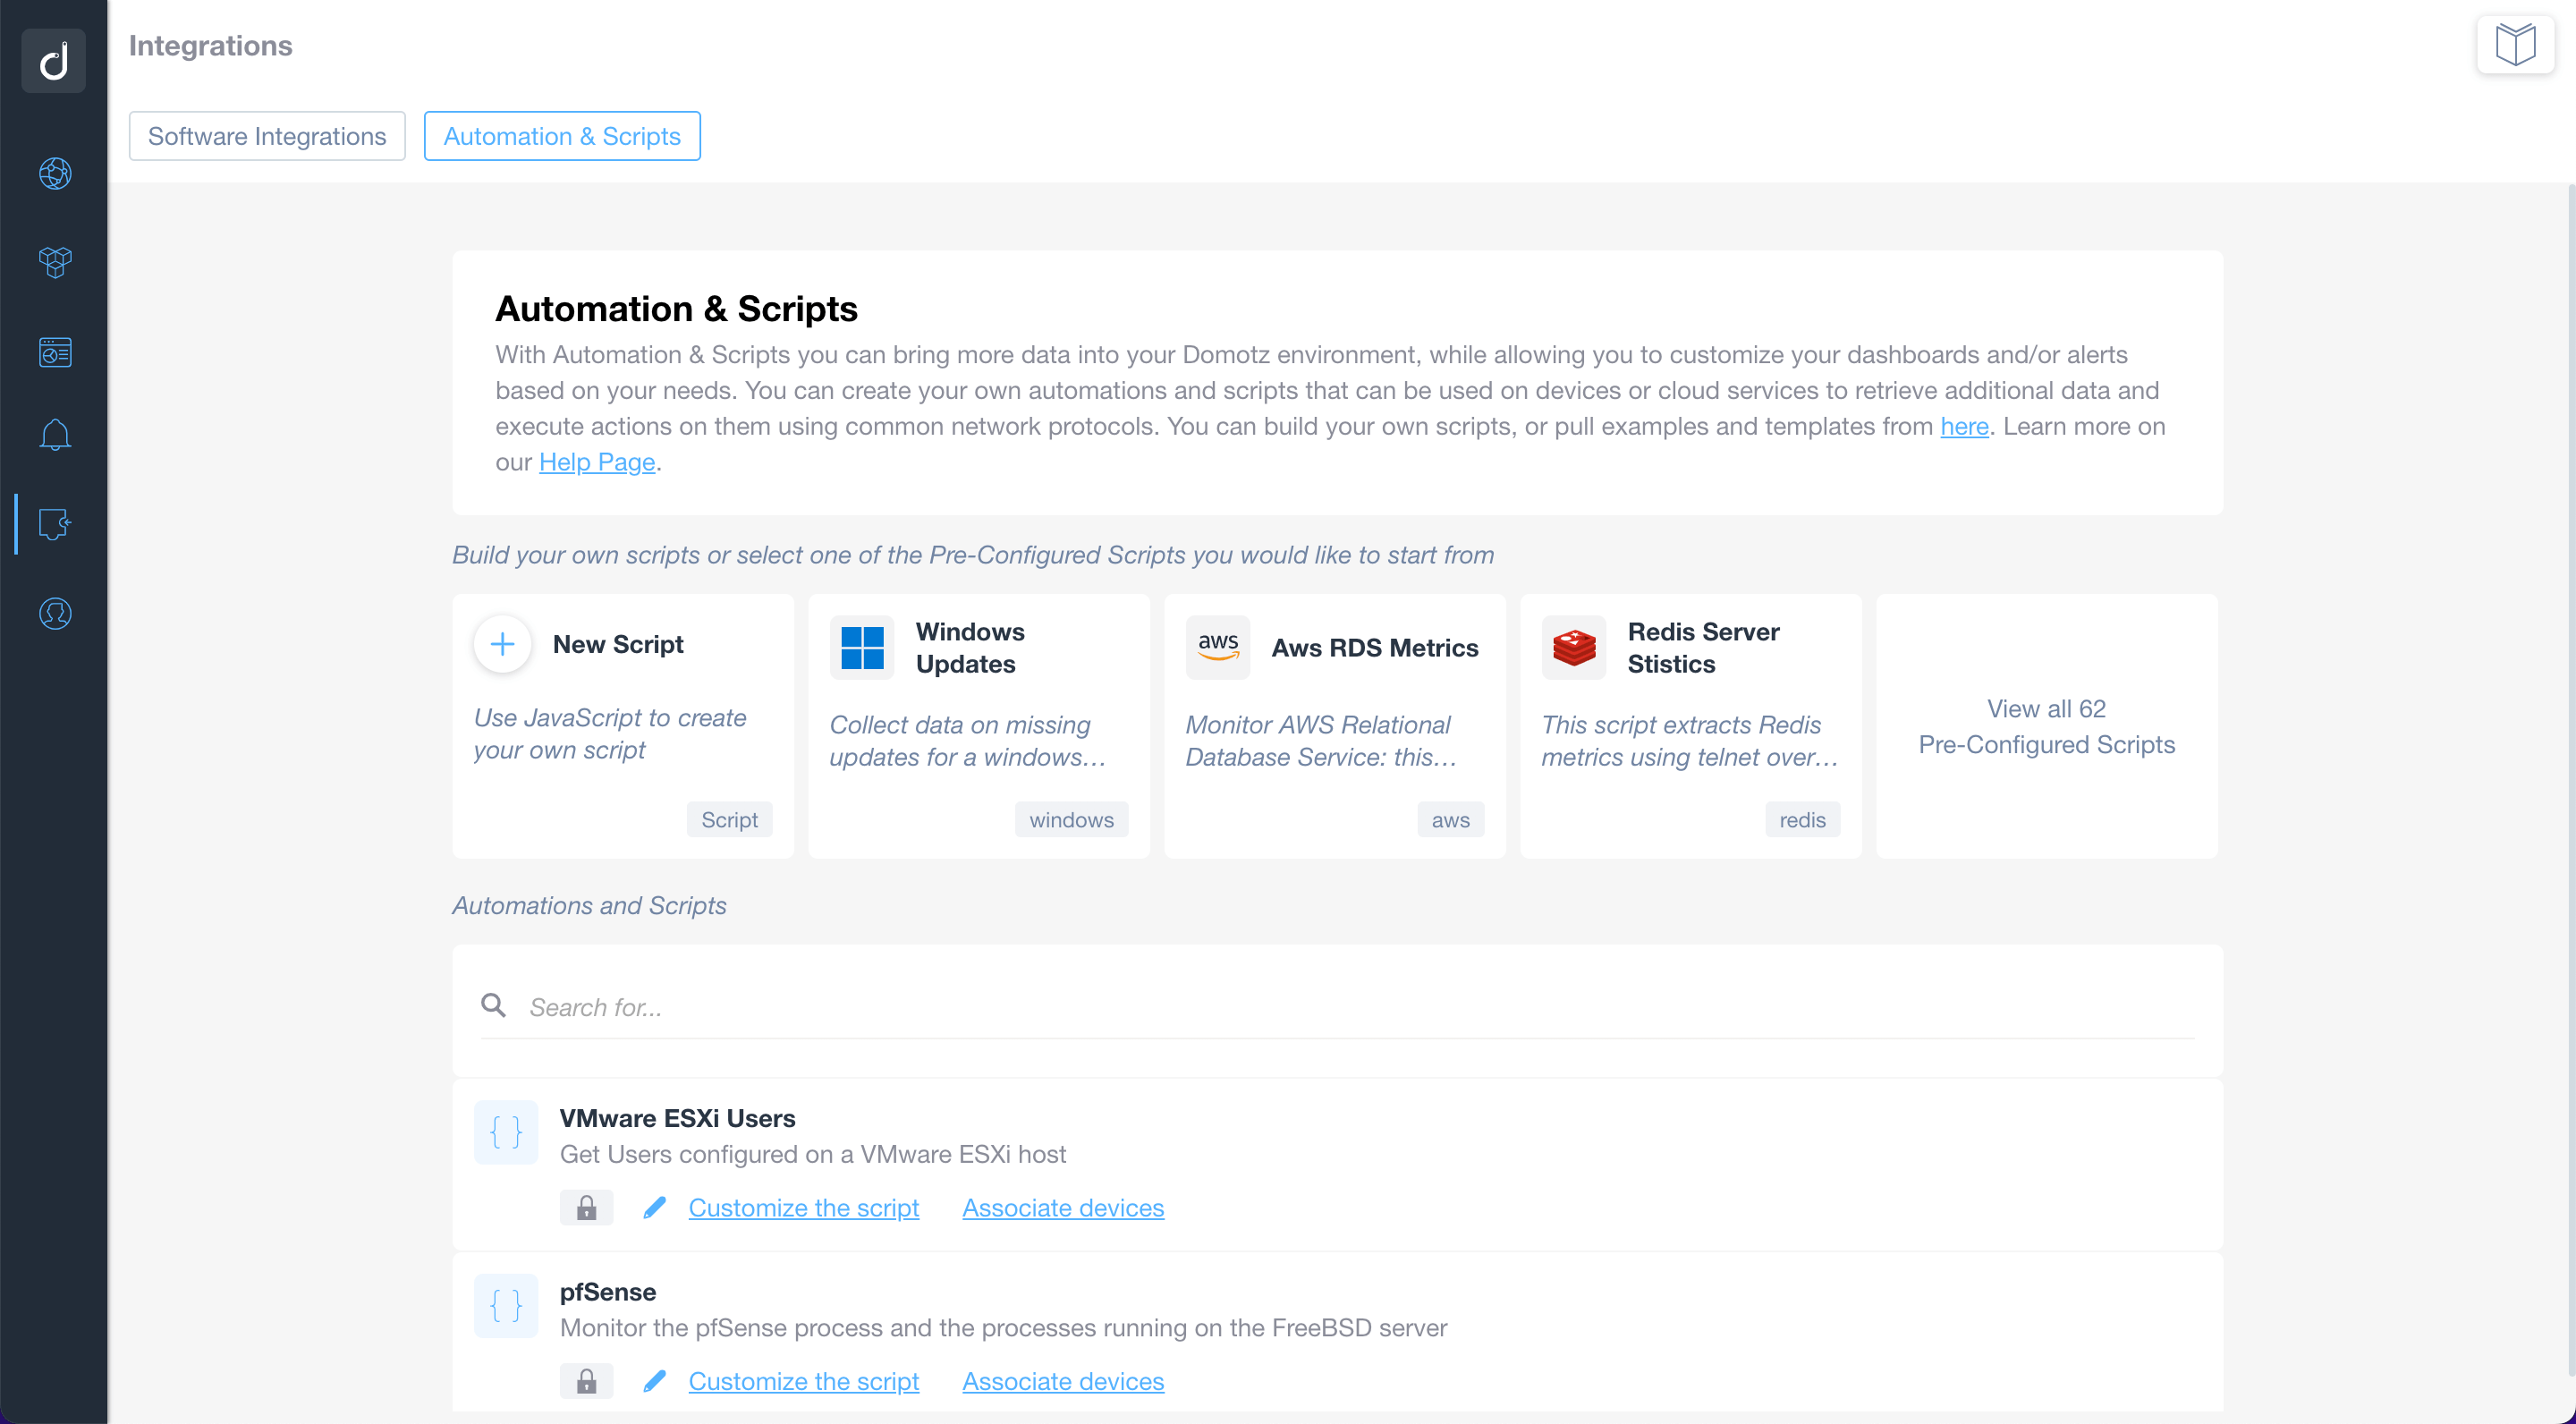
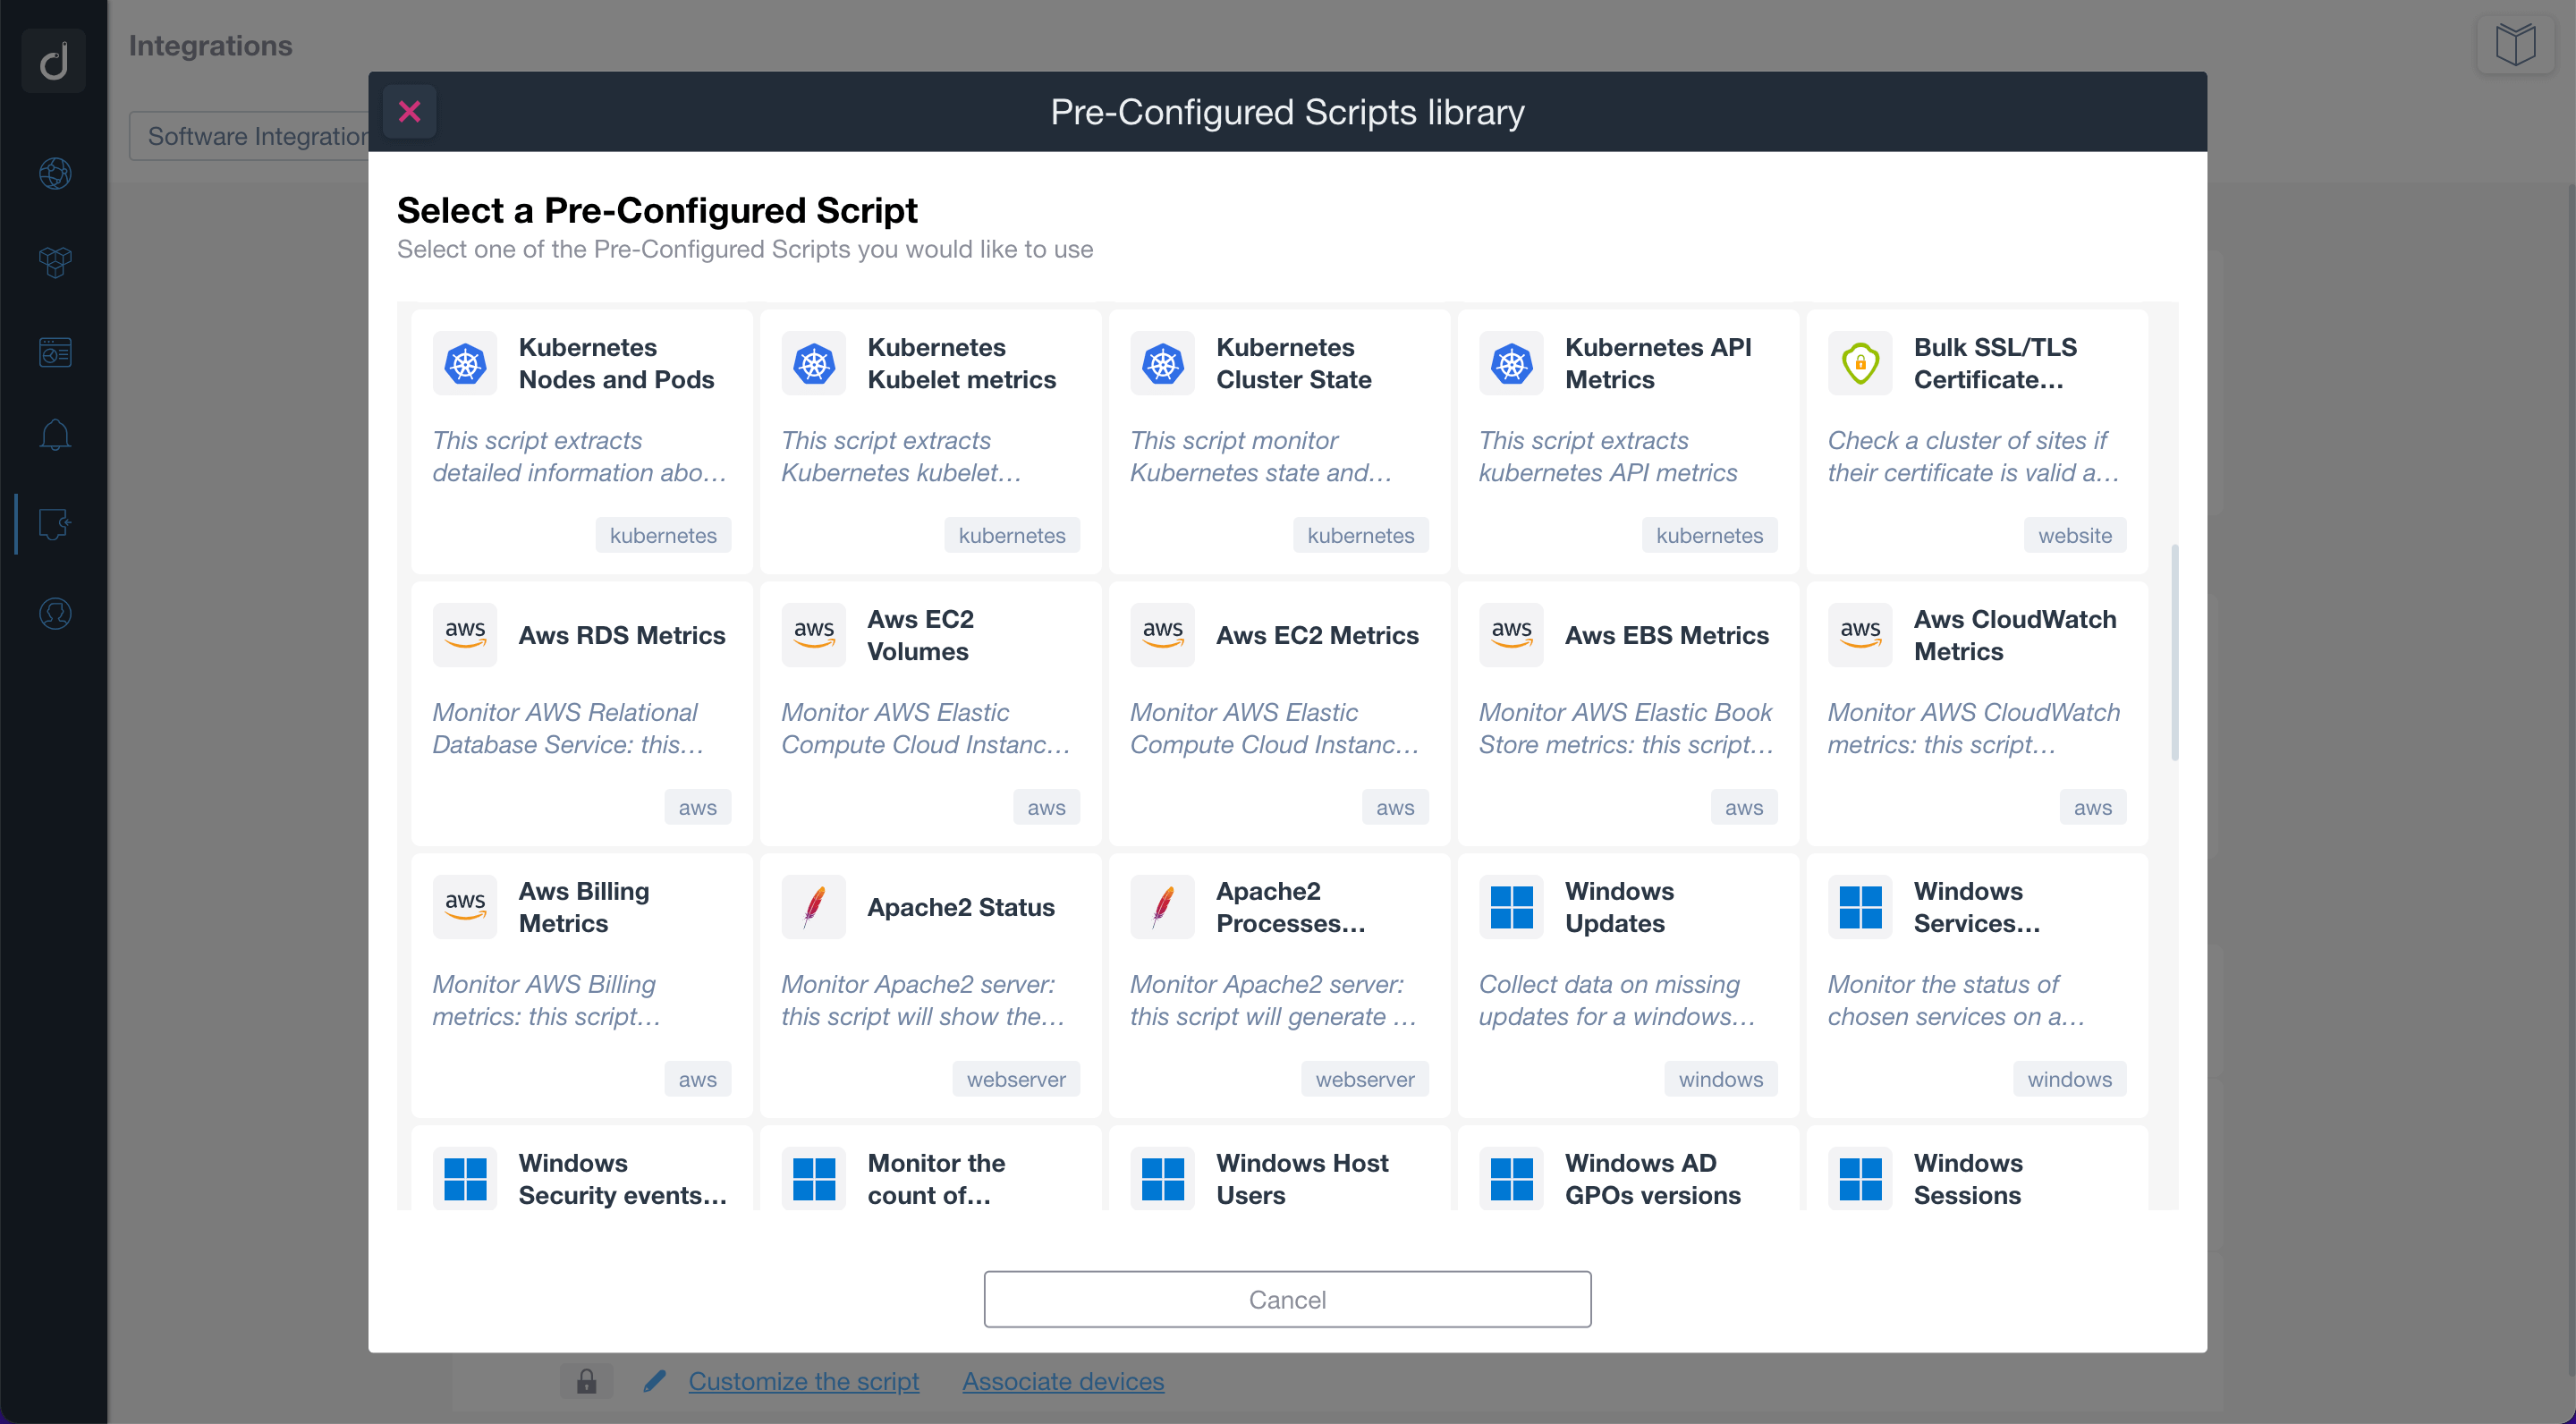
Use the pre-configured scripts to monitor and manage network-connected devices, cloud services, and web applications. By using standard network protocols, the scripts will allow you to retrieve valuable data and execute actions on the monitored devices and services.
Build or customize scripts according to your network monitoring needs.
Additionally, you can apply customized alerts on scripts to be notified when a specific event occurs.
Additional Resources:
Ready to Get Started?
- Uncover Network Blind Spots
- Resolve Issues Faster and Easier
- Exceed Service Delivery Expectations