iDRAC Monitoring
Domotz network monitoring software allows you to proactively monitor Integrated Dell Remote Access Controller (iDRAC), a management platform for server monitoring.
Do you monitor Dell PowerEdge servers?
Use Domotz pre-configured SNMP templates to optimize your iDRAC management. Improve the productivity and ability of your Dell PowerEdge servers. Receive notifications about system issues to resolve remote system management issues in advance. Get a better insight into the performance of the servers you manage to improve your overall server management.
Use Domotz and iDRAC to deploy, update and monitor PowerEdge servers anywhere, anytime.

How to monitor iDRAC
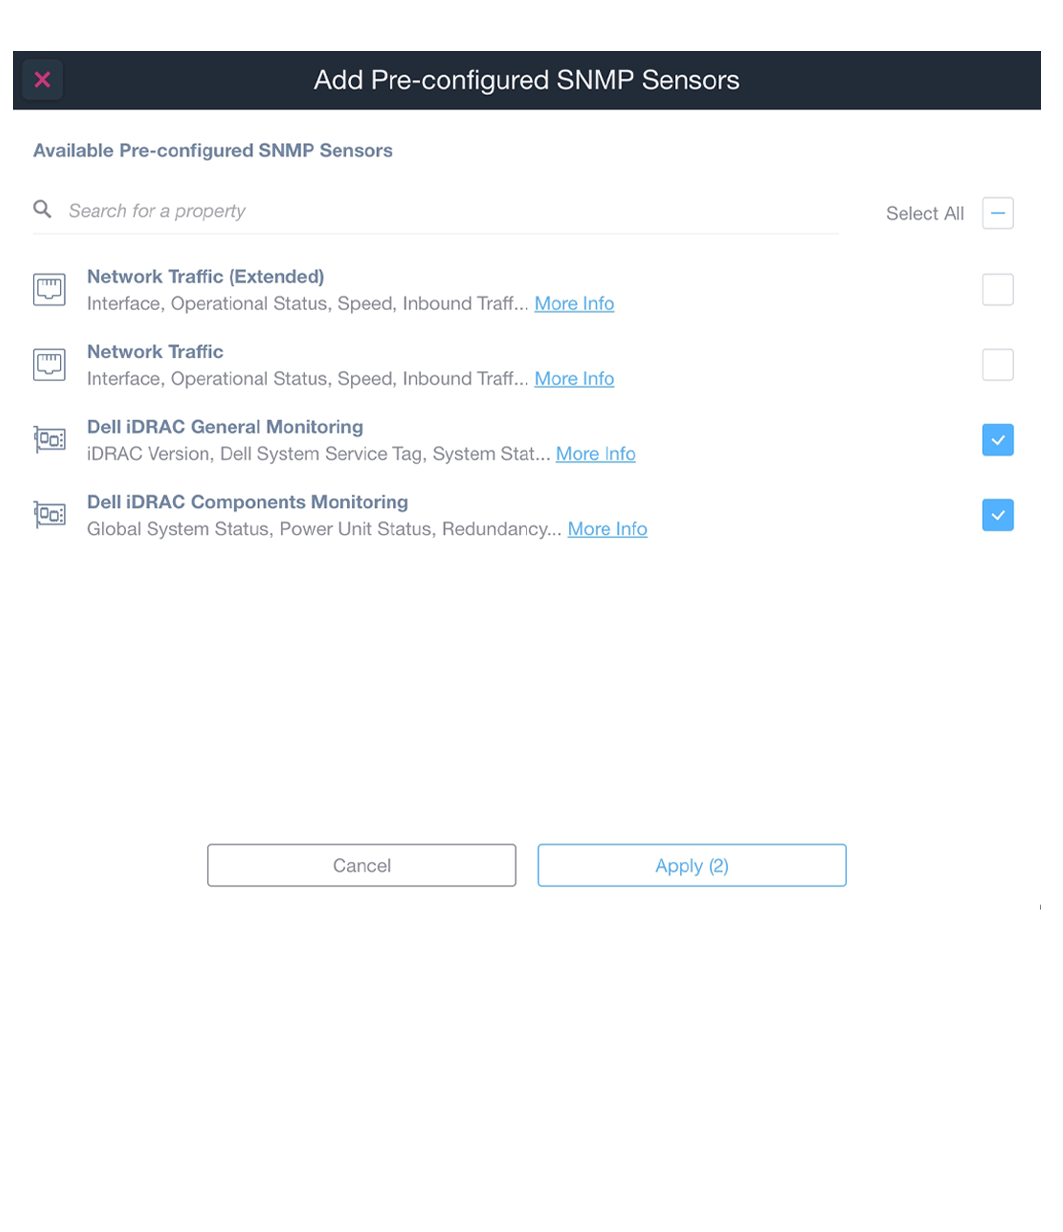
Monitor specific items for your iDRAC management platform using the following pre-configured SNMP templates:
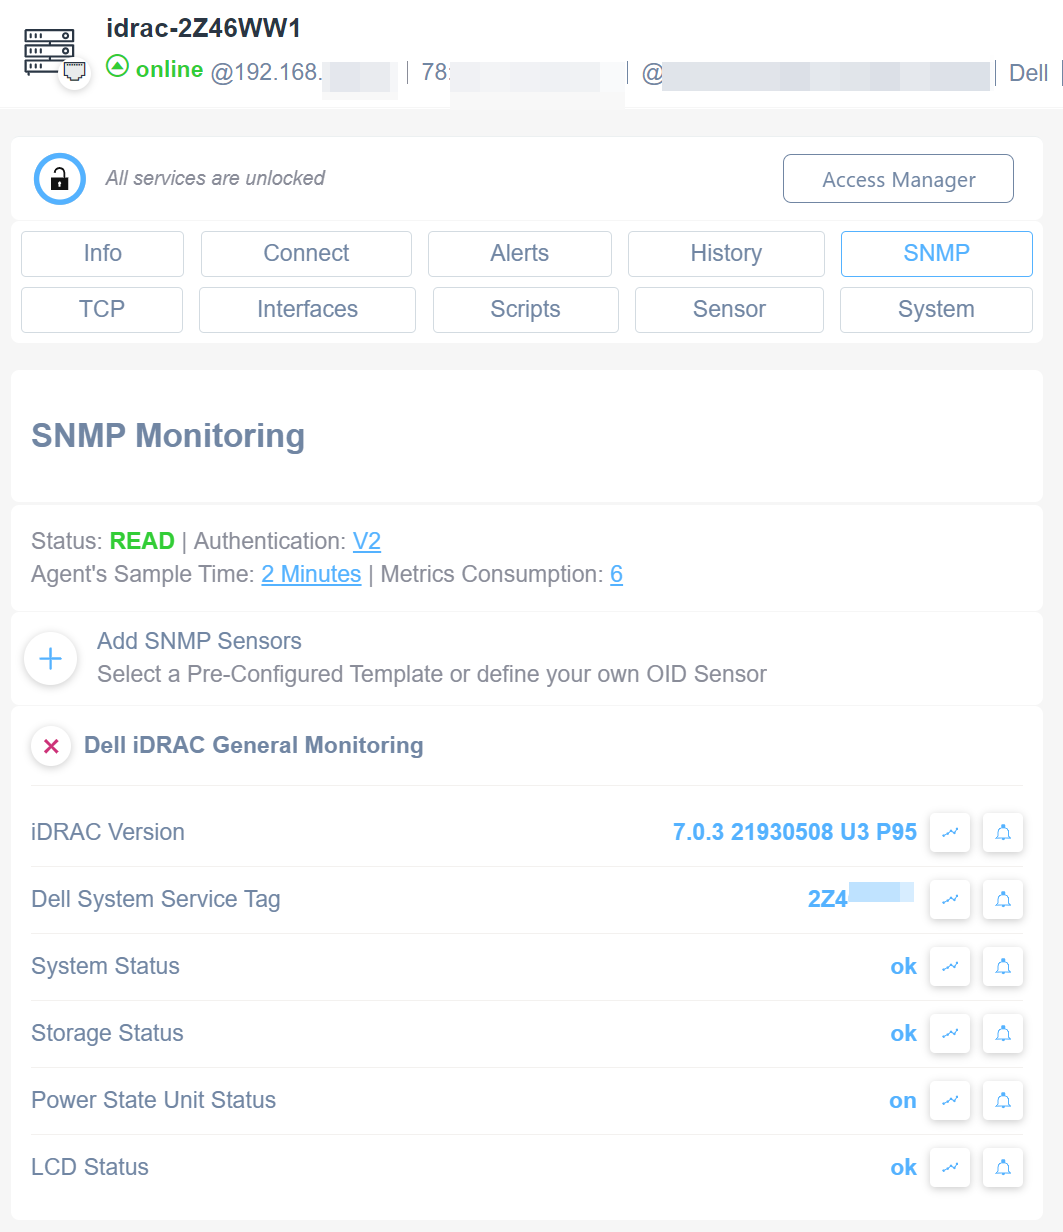
- Dell iDRAC General Monitoring: an SNMP pre-configured template is available to help you extract general properties such as the iDRAC version, system/storage status, Dell system service tag, and power state unit status
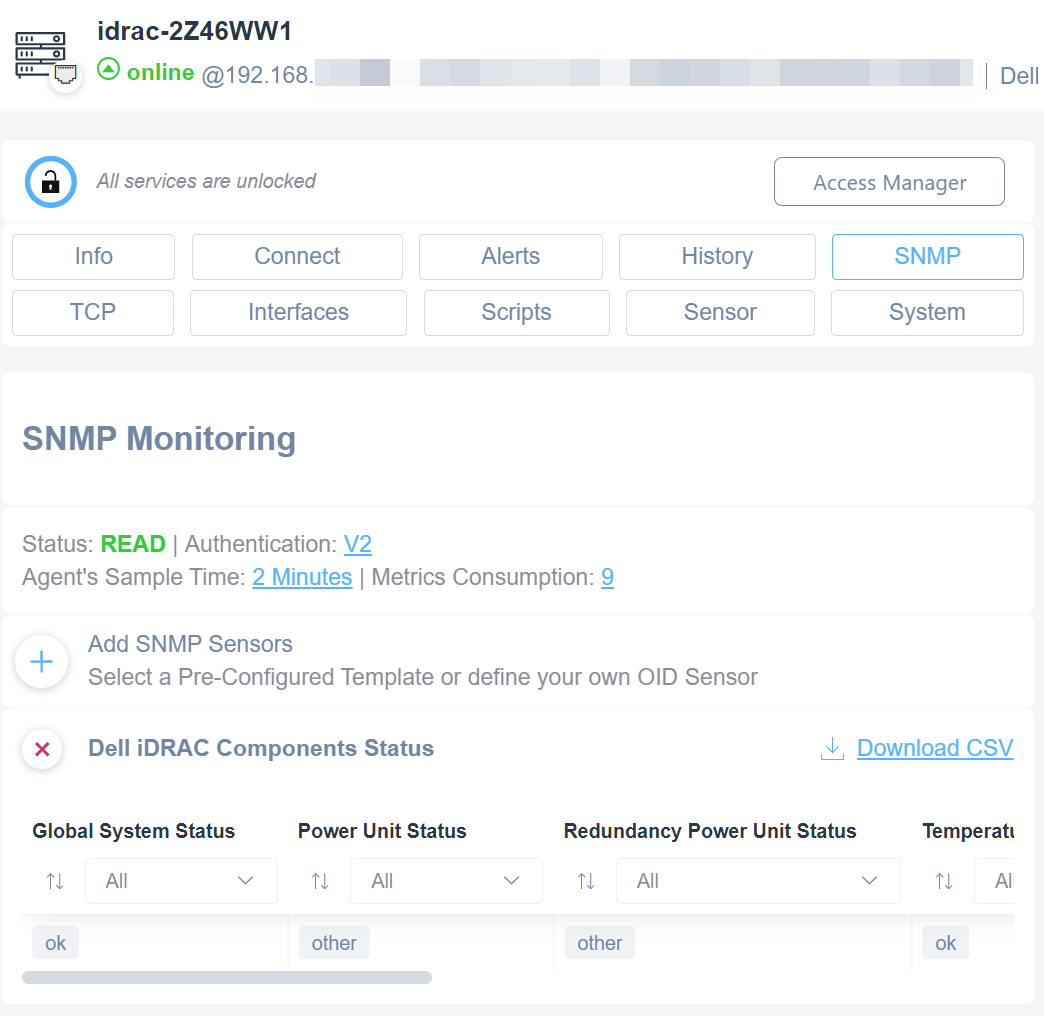
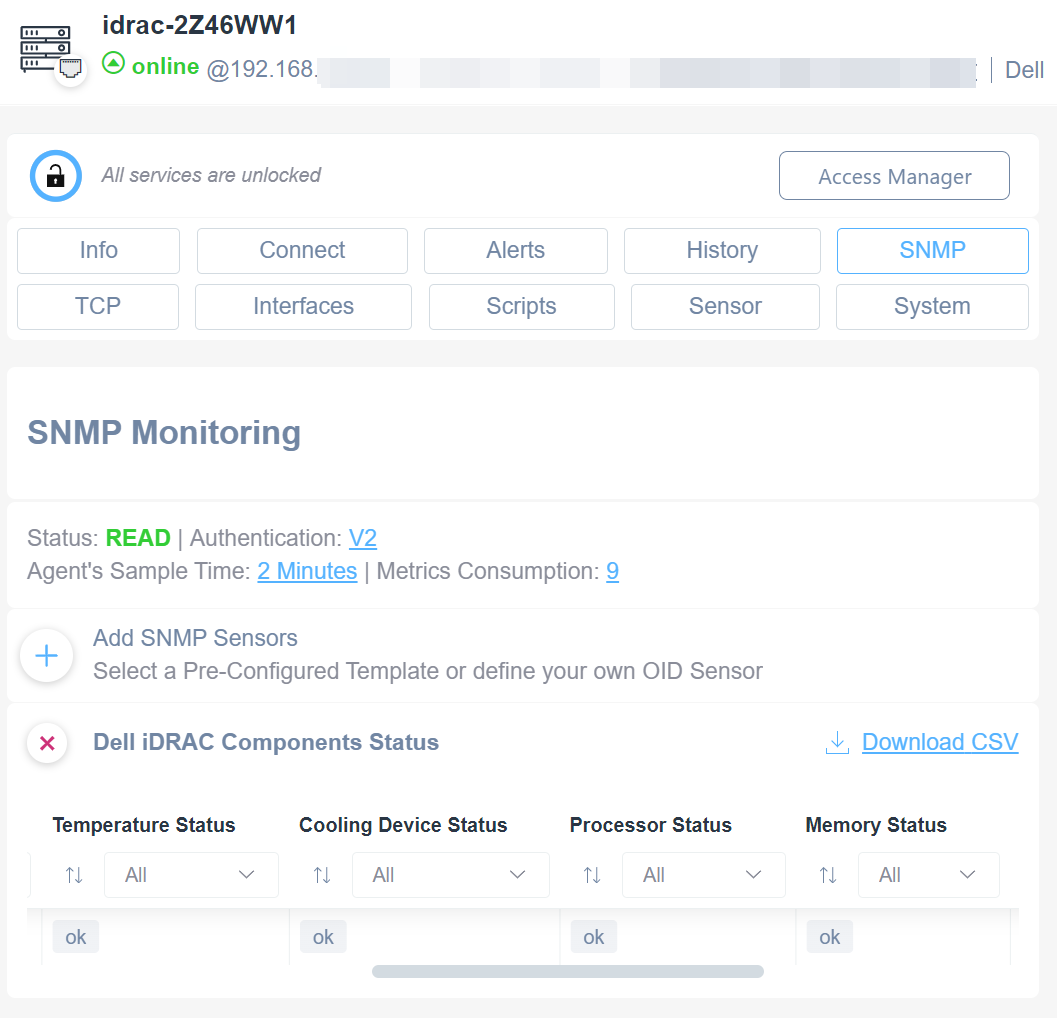
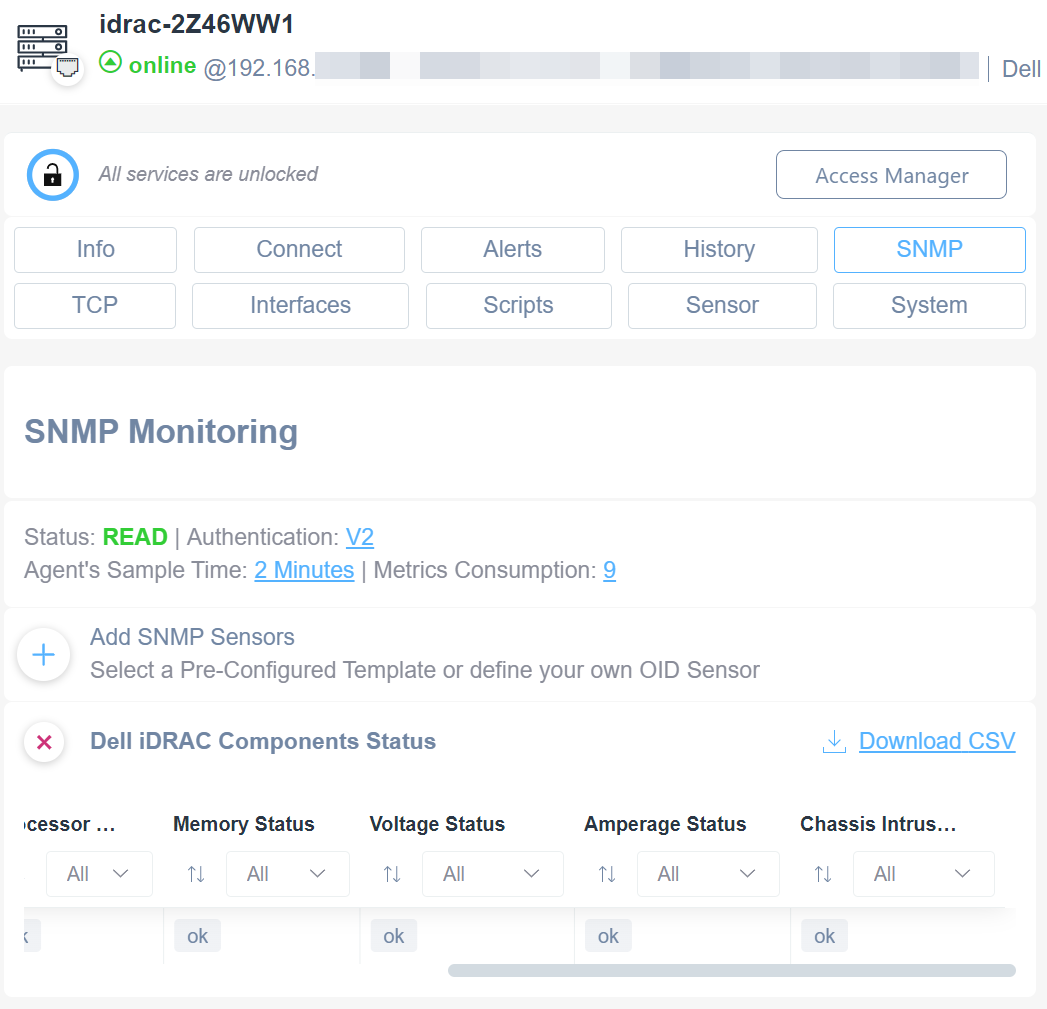
- Dell iDRAC Components Monitoring: use this SNMP pre-configured template to monitor global system status, power unit status, temperature, memory, voltage, and redundancy
You can apply our custom scripts to monitor Physical HDs, RAID, Memory, Fans, and Processors on a Dell Server equipped with an iDRAC controller.
The script uses SSH as a communication protocol and has been validated and tested on iDRAC 7, firmware 2.6.5.
Improve your overall efficiency with Domotz and iDRAC.
Easily monitor iDRAC Physical HDs
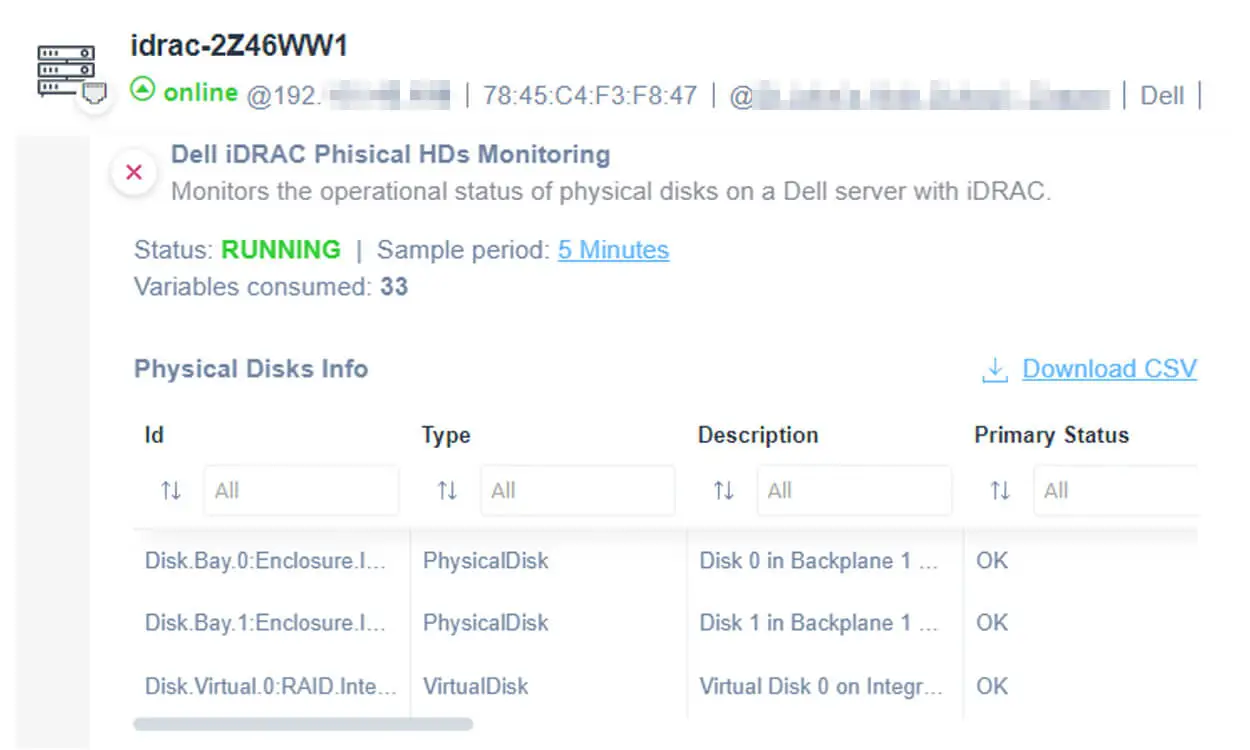
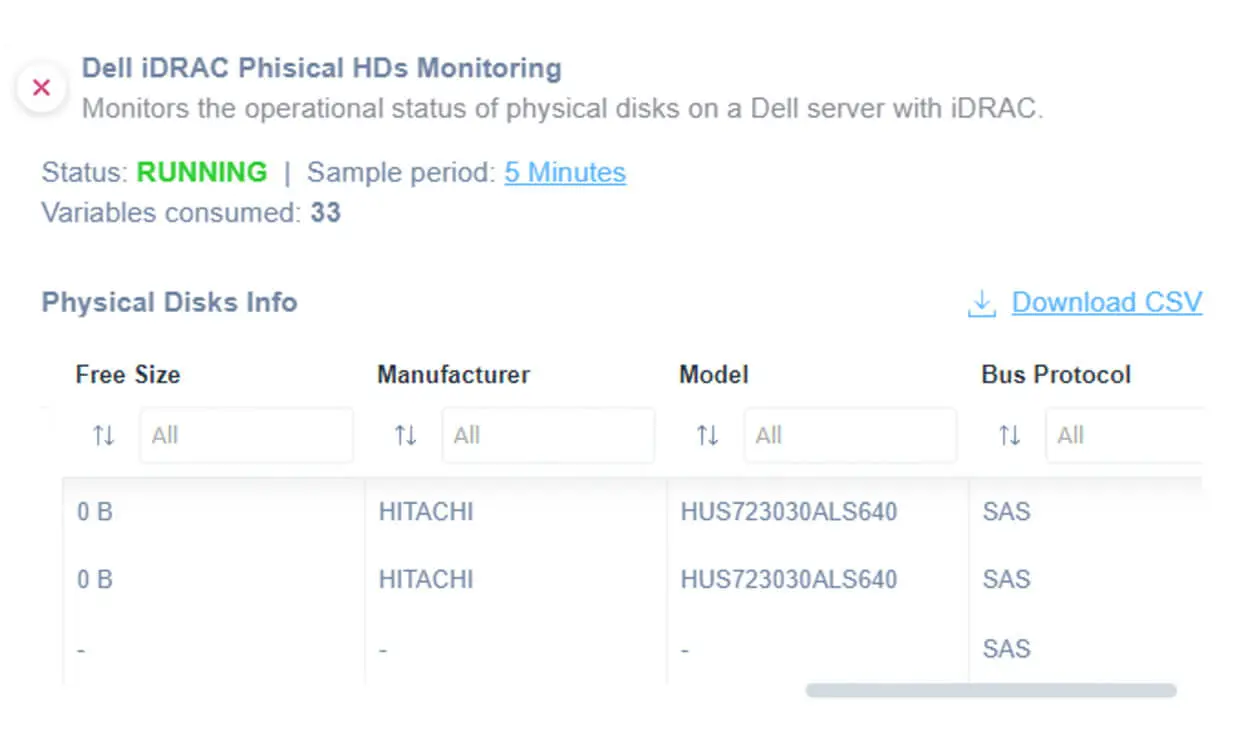
By applying the Physical HDs script, you will be able to monitor all this information:
- Type
- Description
- Primary Status
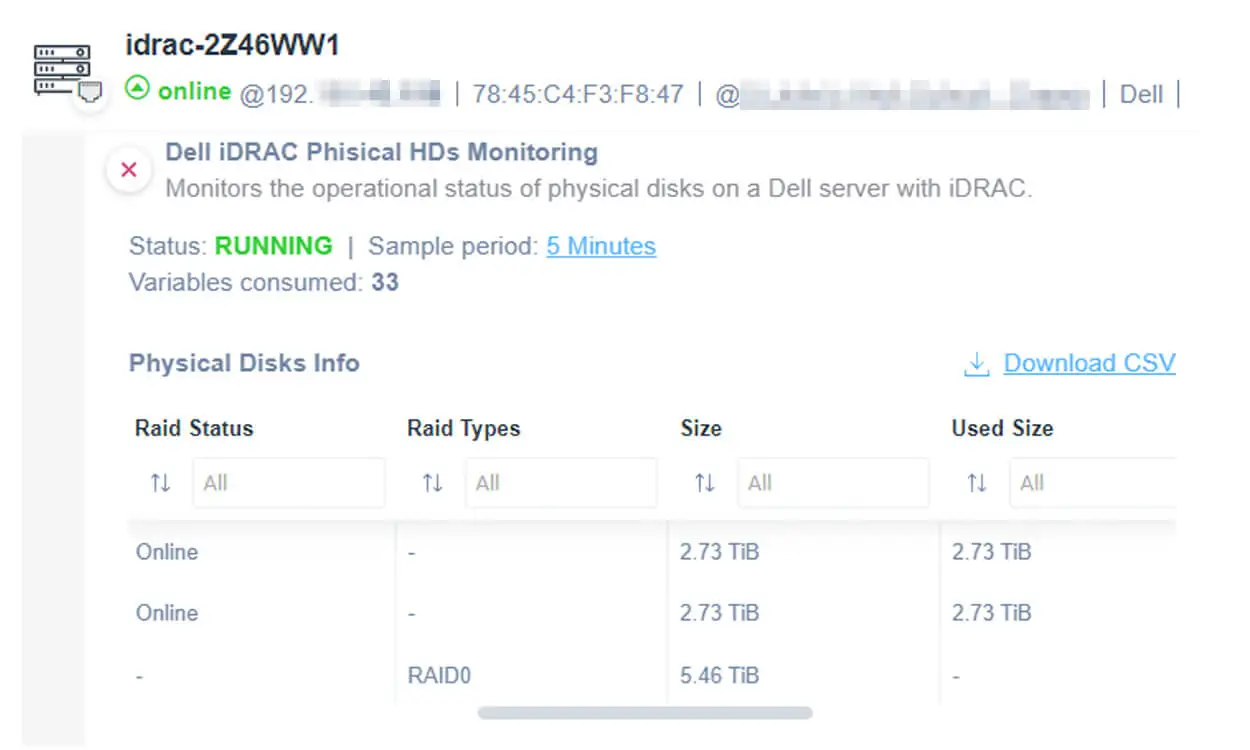
- Raid Status
- Raid Types
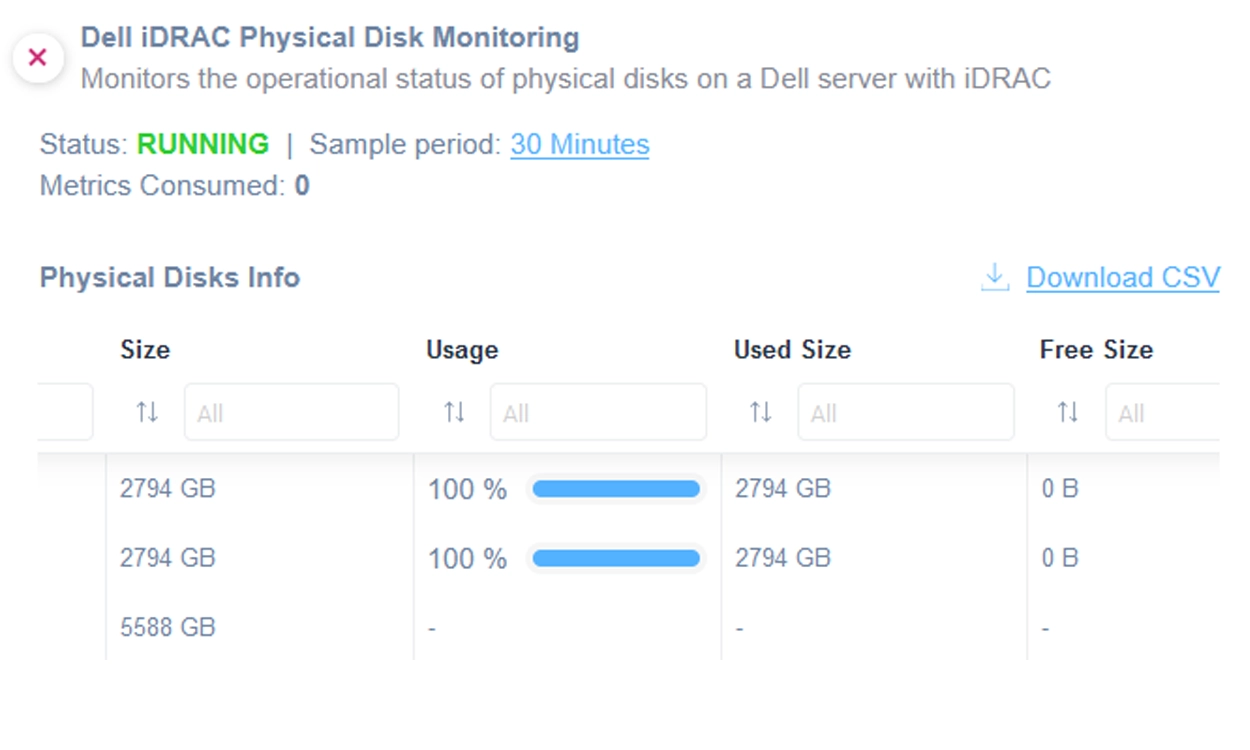
- Size
- Used Size
- Free Size
- Manufacturer
- Model
- Bus protocol
Stay updated on the changes to your critical devices in your network. You can also find the Physical HDs script on GitHub.
Quickly retrieve information about iDRAC Raid Monitoring
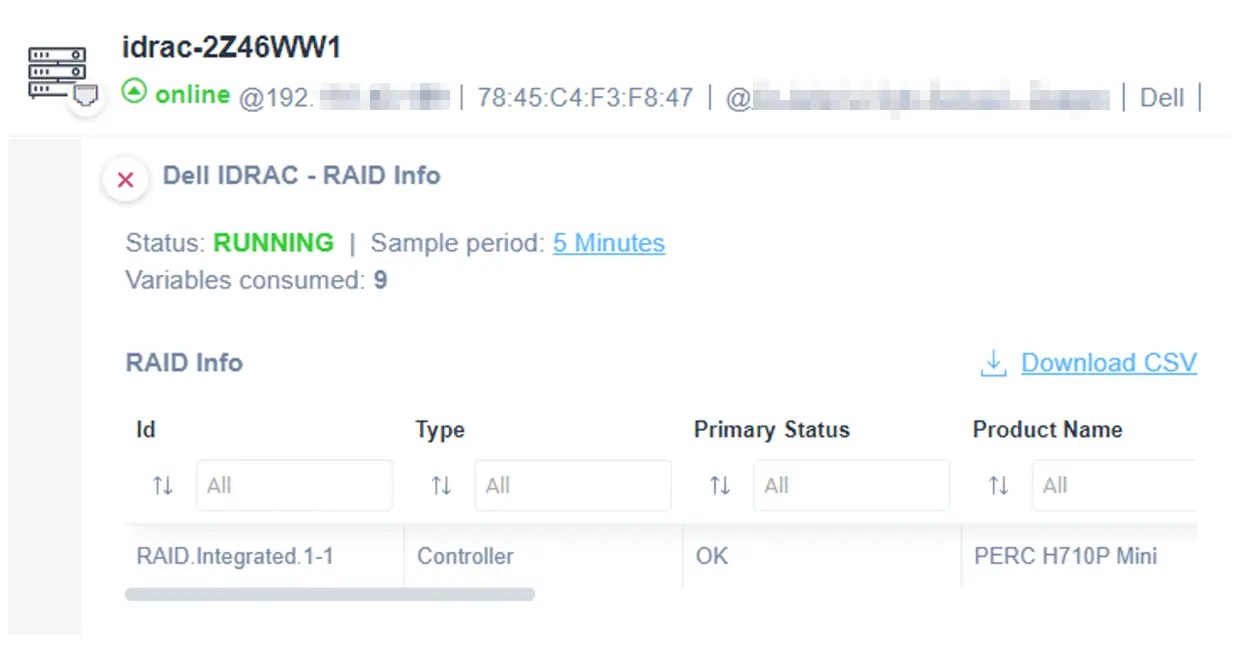
By choosing the Raid Monitoring script, you will be able to get access to this data:
- Type
- Primary Status
- Product Name
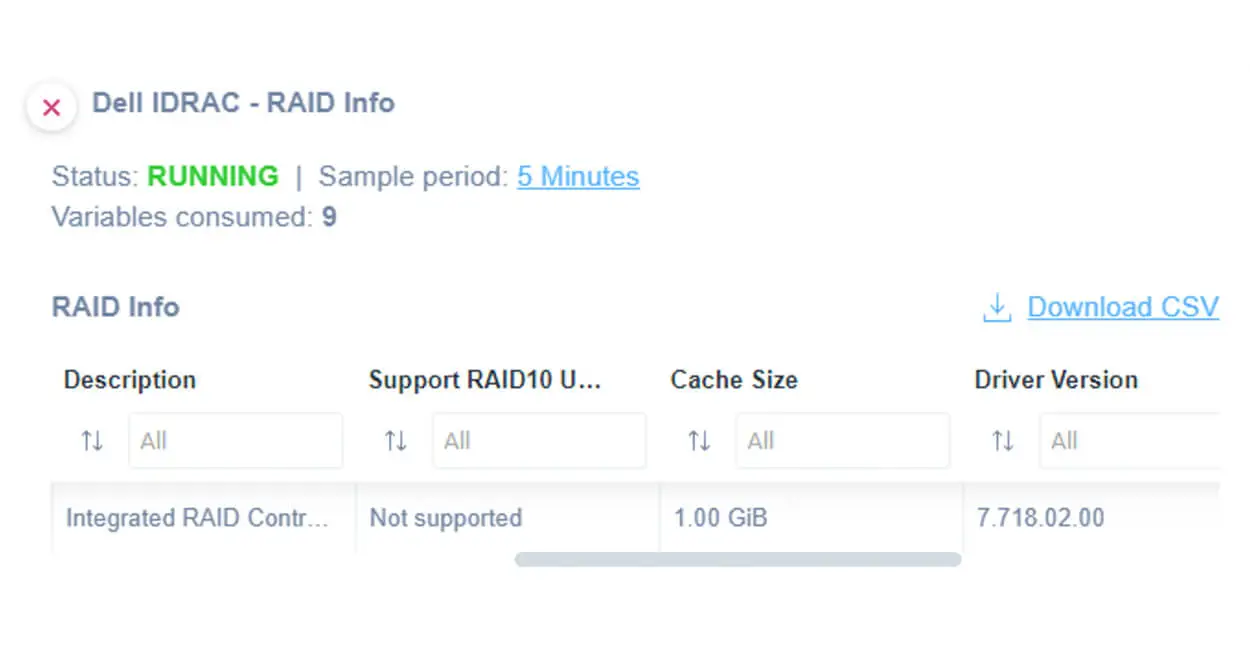
- Description
- Support RAID 10 Uneven Spans
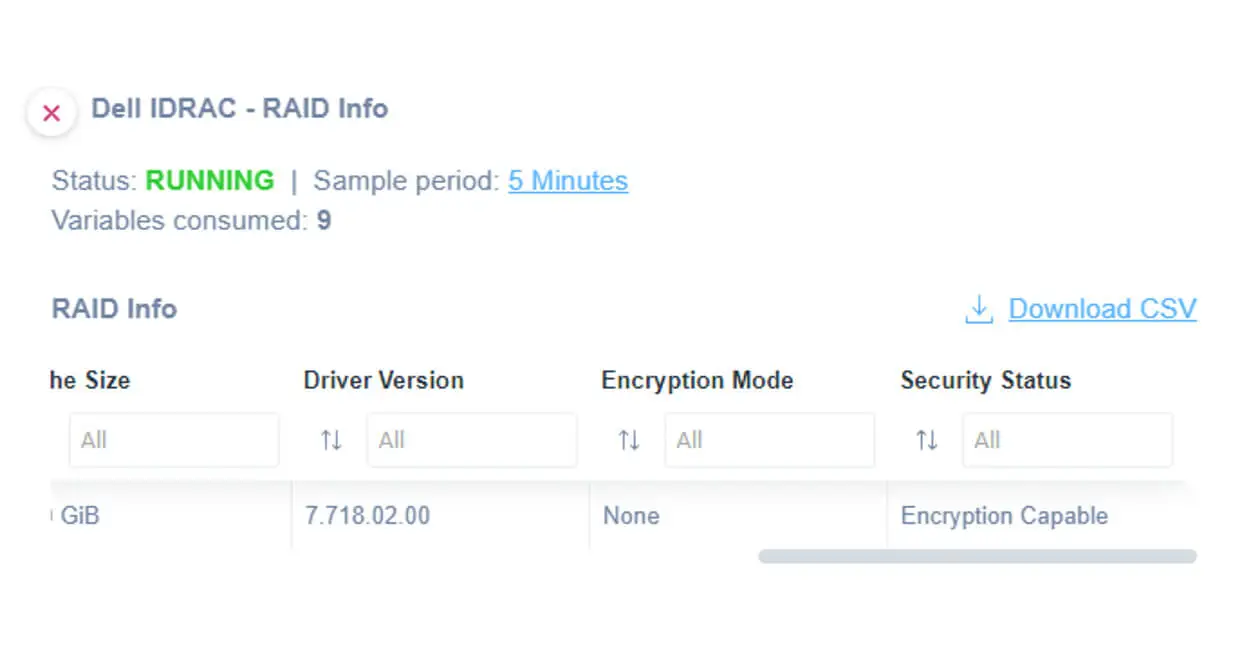
- Cache Size
- Driver Version
- Encryption Mode
- Security Status
Stay updated on the changes to your critical devices. You can also find the Raid Monitoring script on GitHub.
Get more information from your iDRAC PSU Monitoring
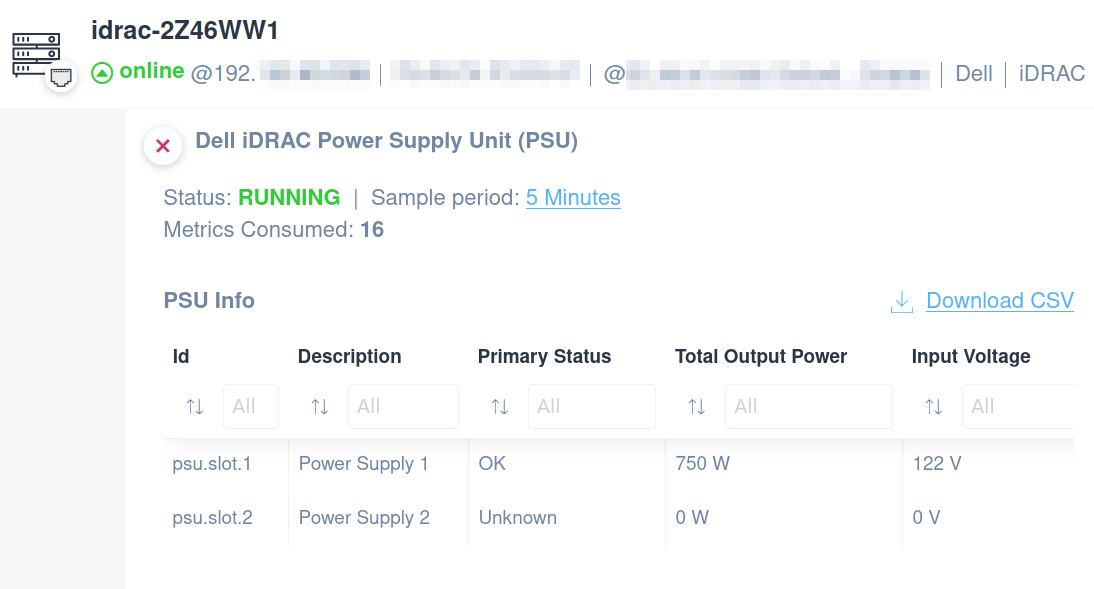
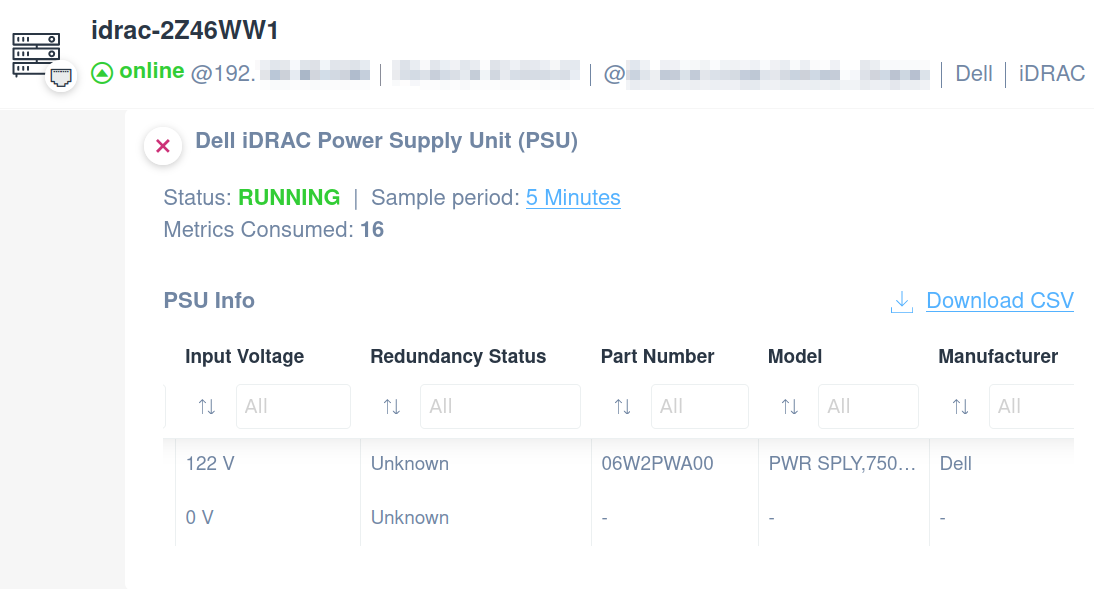
By choosing the PSU (Power Supply Unit) Monitoring script, you will be able to get access to this data:
- Power Supply Description
- Primary Status
- Total Output Power
- Input Voltage
- Redundancy Status
- Part Number
- Model
- Manufacturer
You can also find the PSU Monitoring script on our library.
Never miss an update on Memory’s KPIs
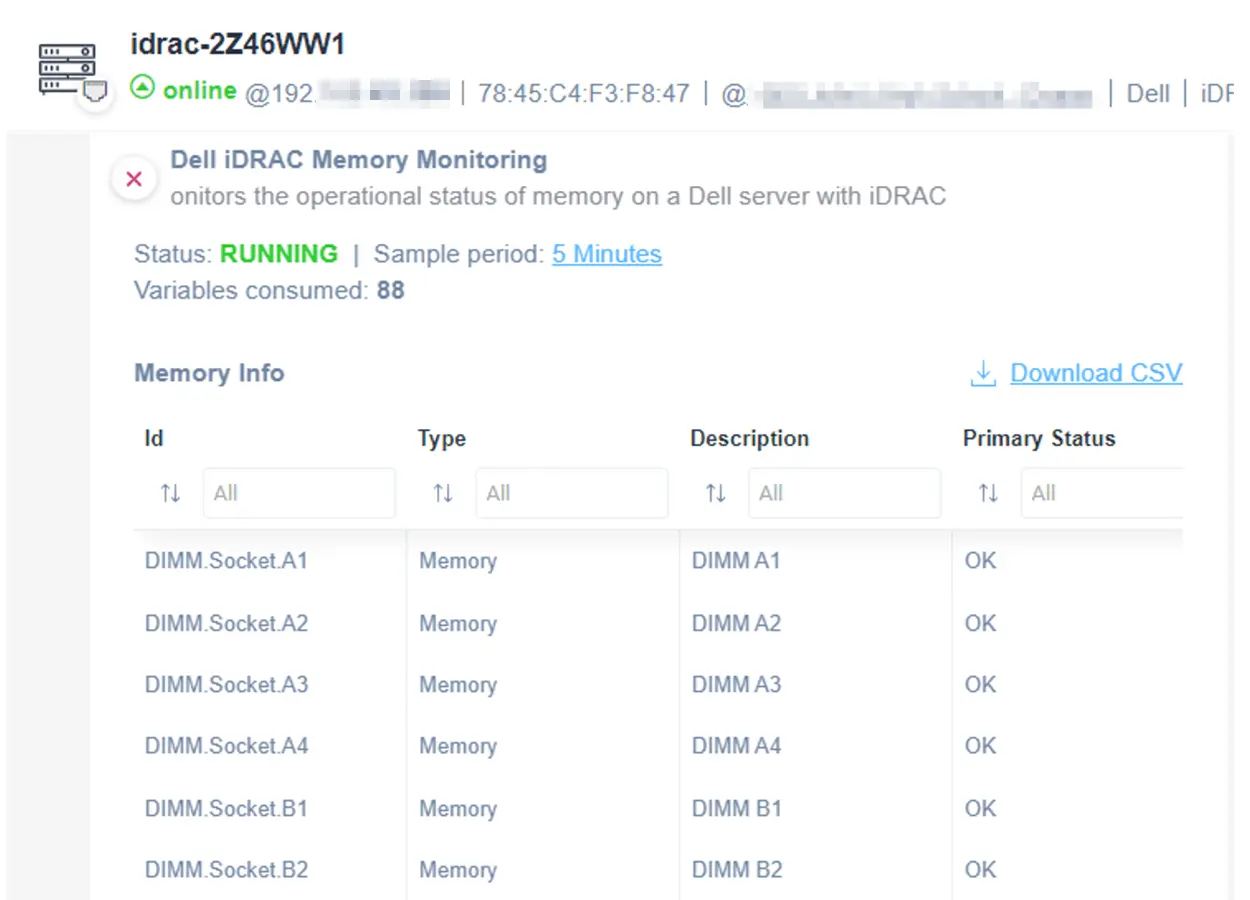
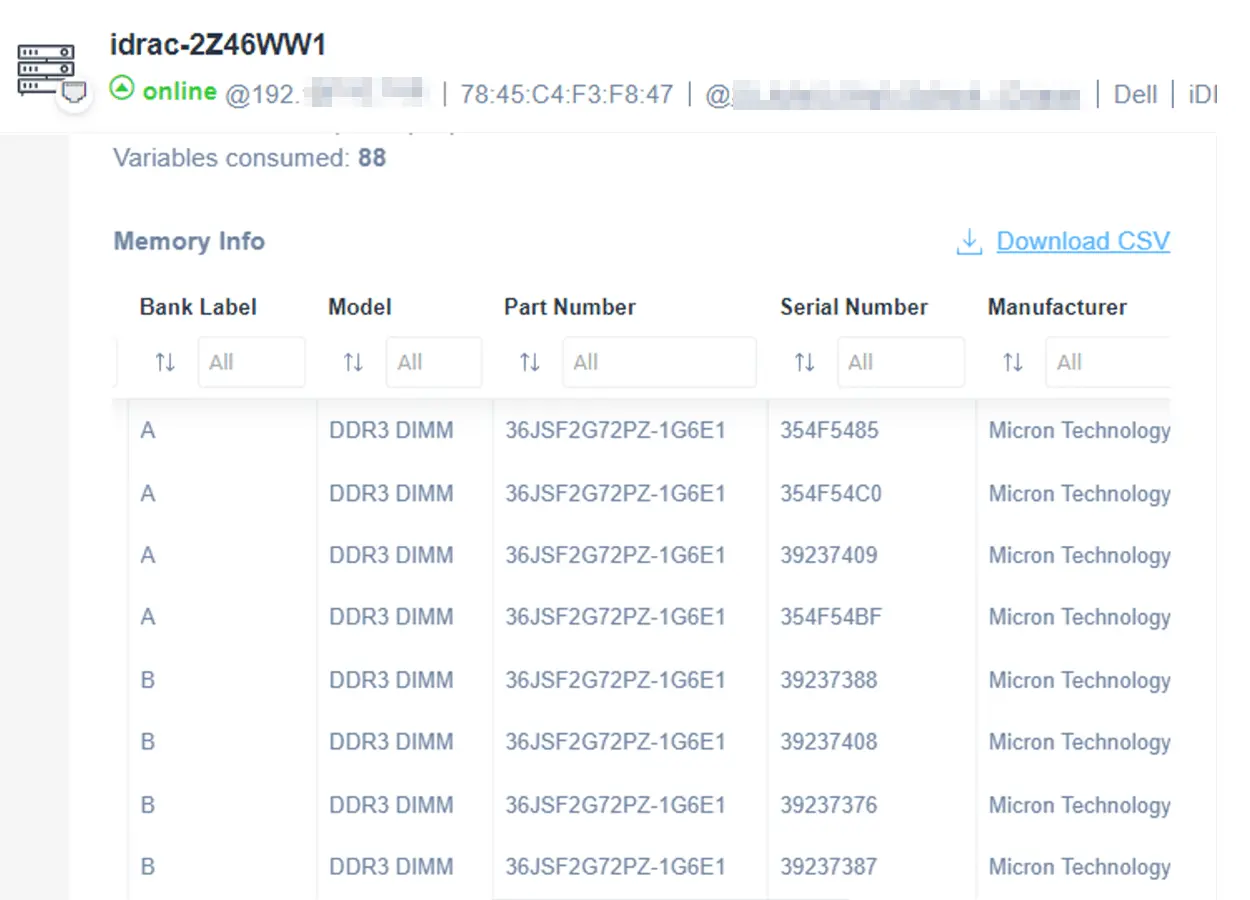
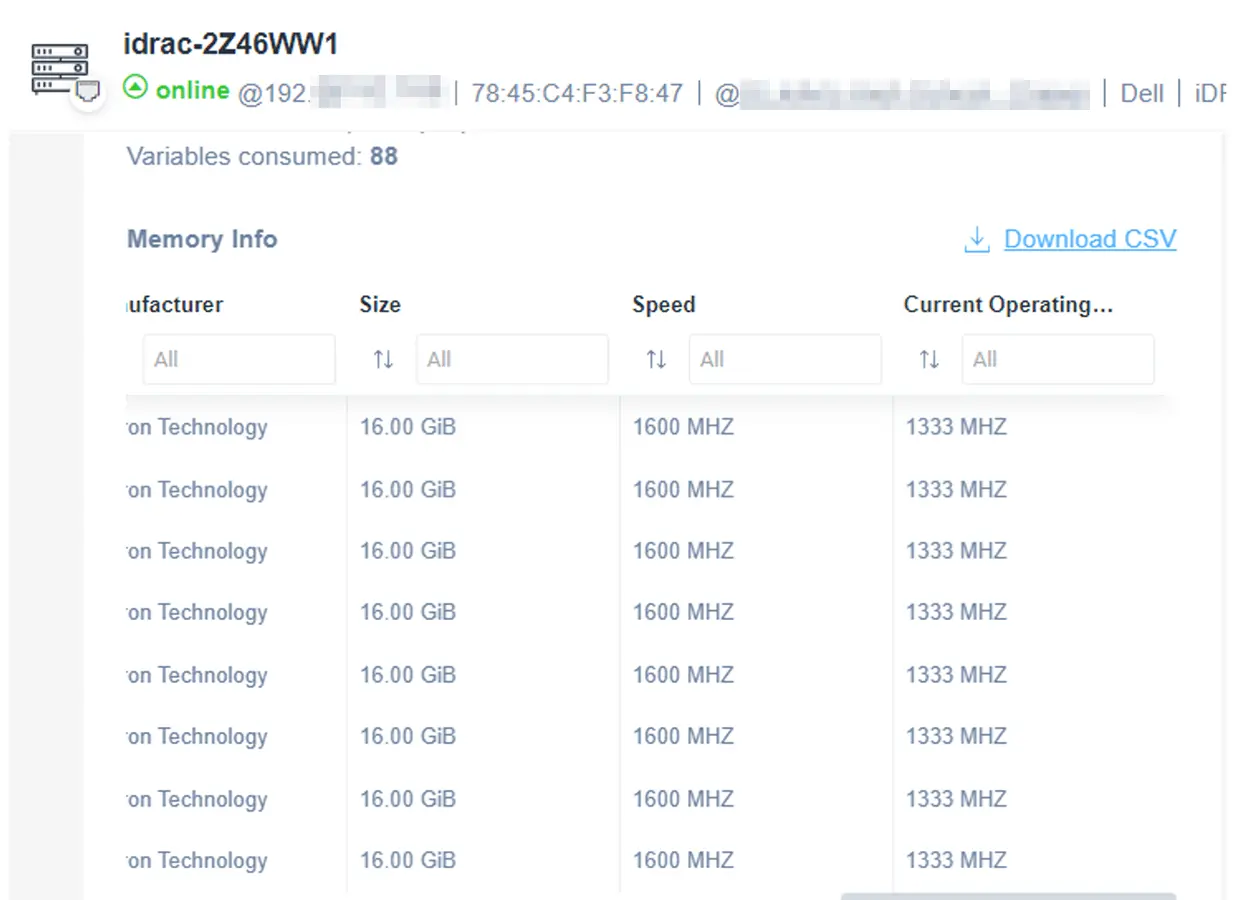
Use Domotz’s Memory Monitoring script to retrieve more data:
- Type
- Description
- Primary Status
- Bank Label
- Model
- Part Number
- Serial Number
- Manufacturer
- Size
- Speed
- Current Operating Speed
Stay updated on the changes to your critical devices. You can also find the Memory Monitoring script on GitHub.
Fan Monitoring has never been so powerful
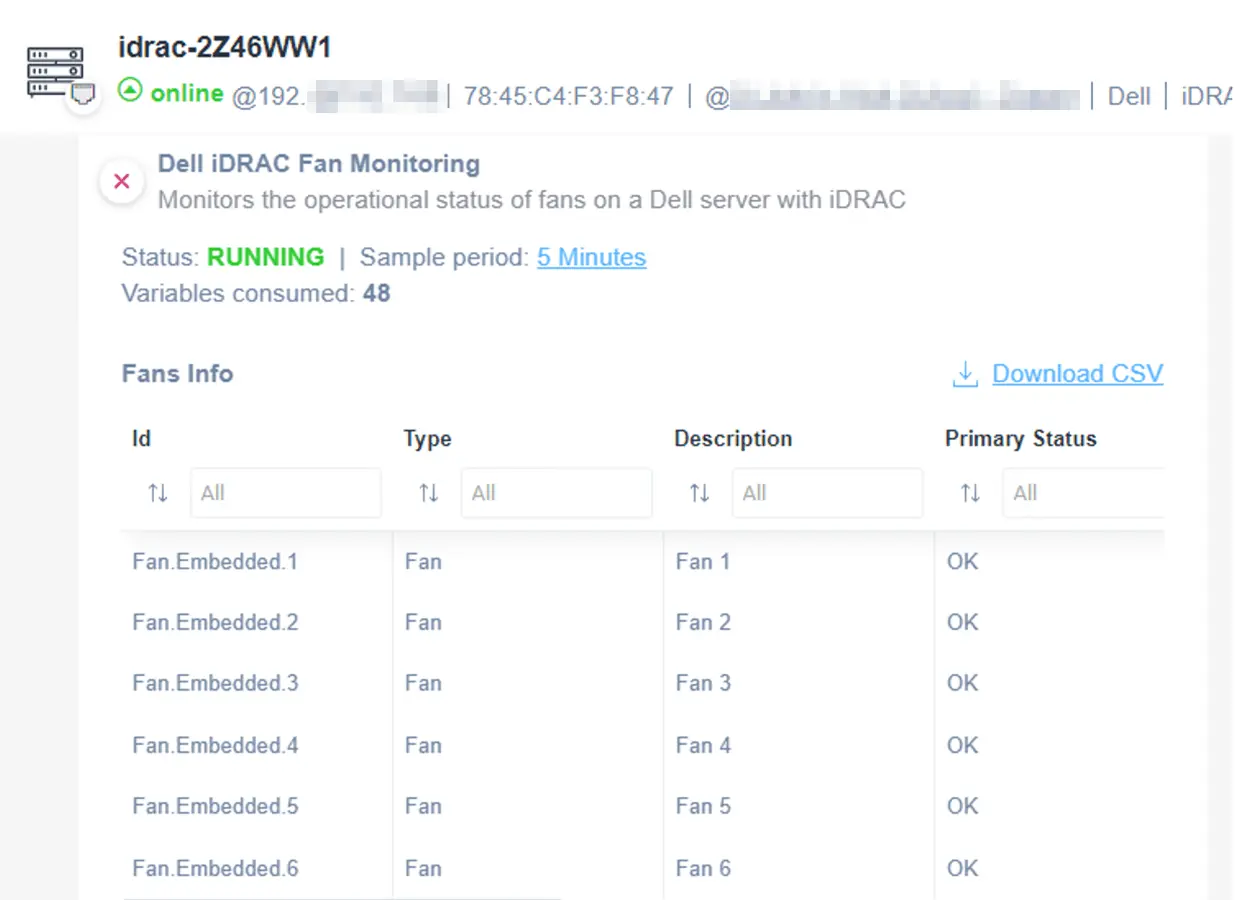
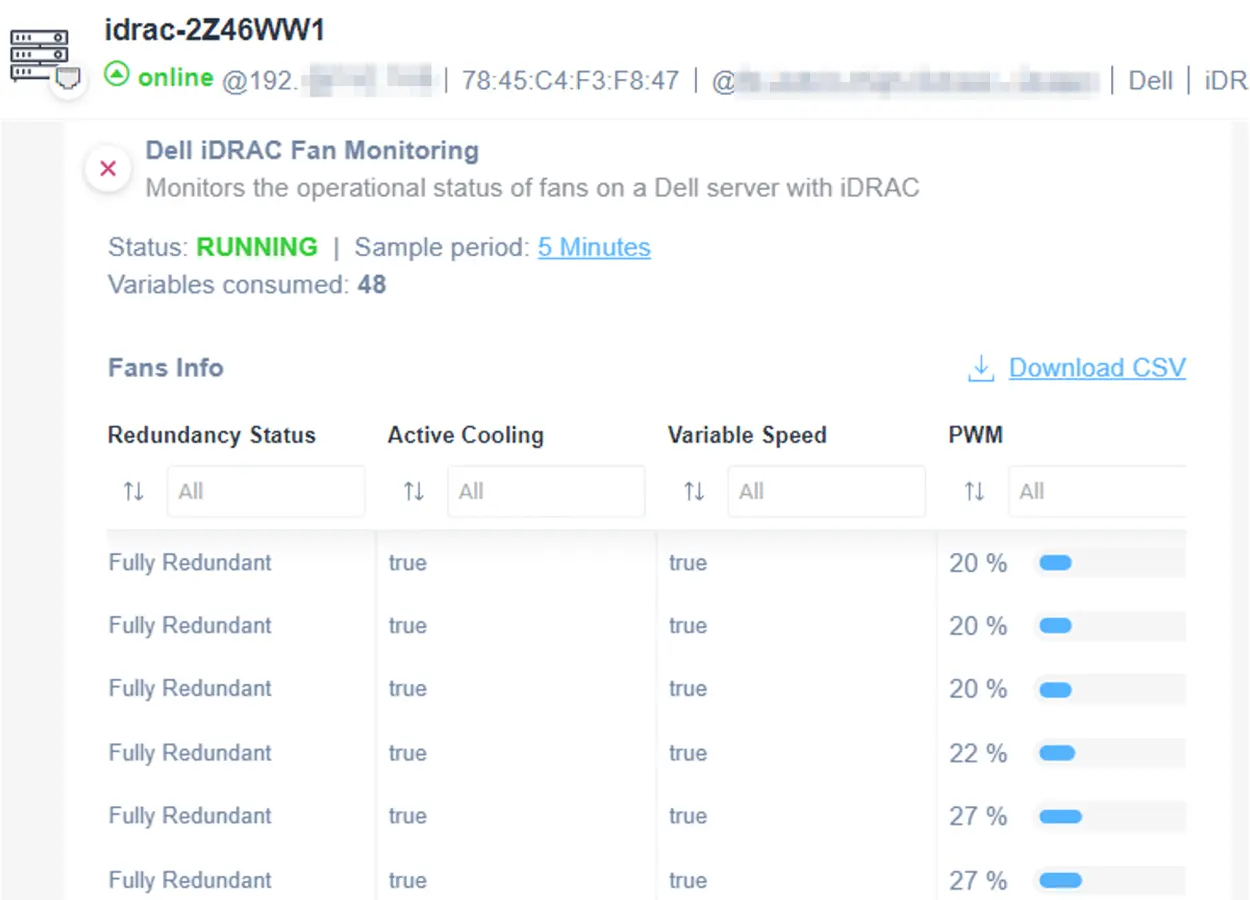
Use Domotz’s Memory Monitoring script to retrieve more data:
- Type
- Description
- Primary Status
- Redundancy Status
- Active Cooling
- Variable Speed
- PWM (Pulse Width Modulation percentage)
- Current Reading
Stay updated on the changes to your critical devices. You can also find the Fan Monitoring script on GitHub.
Gain all the information you need about Processors
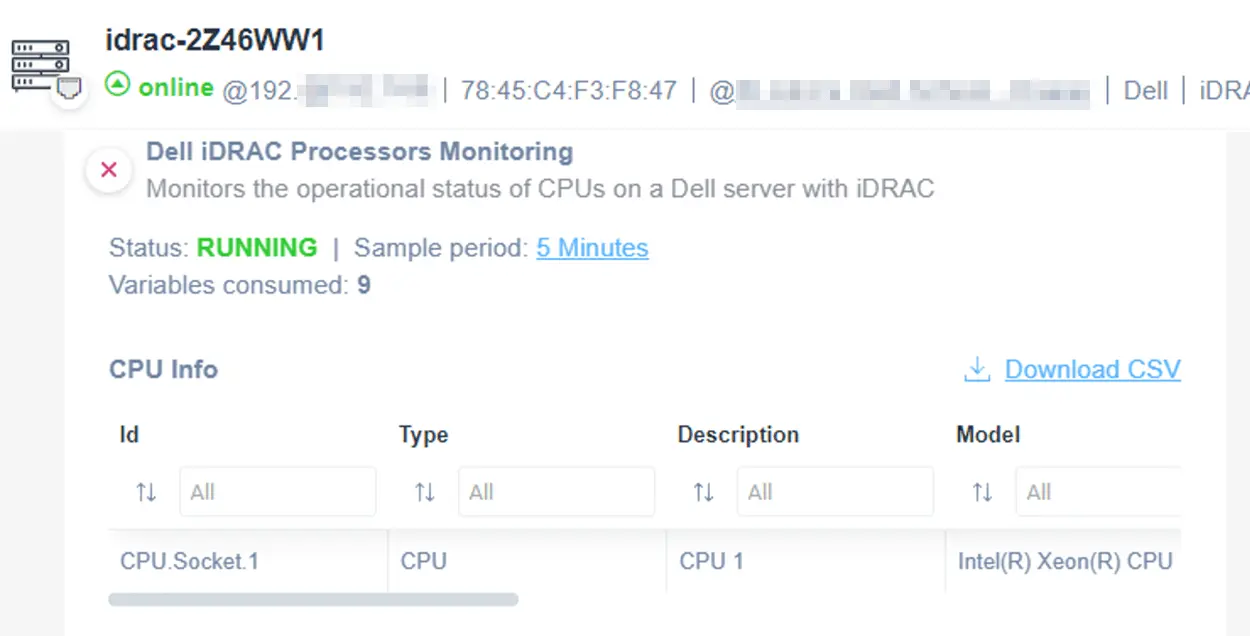
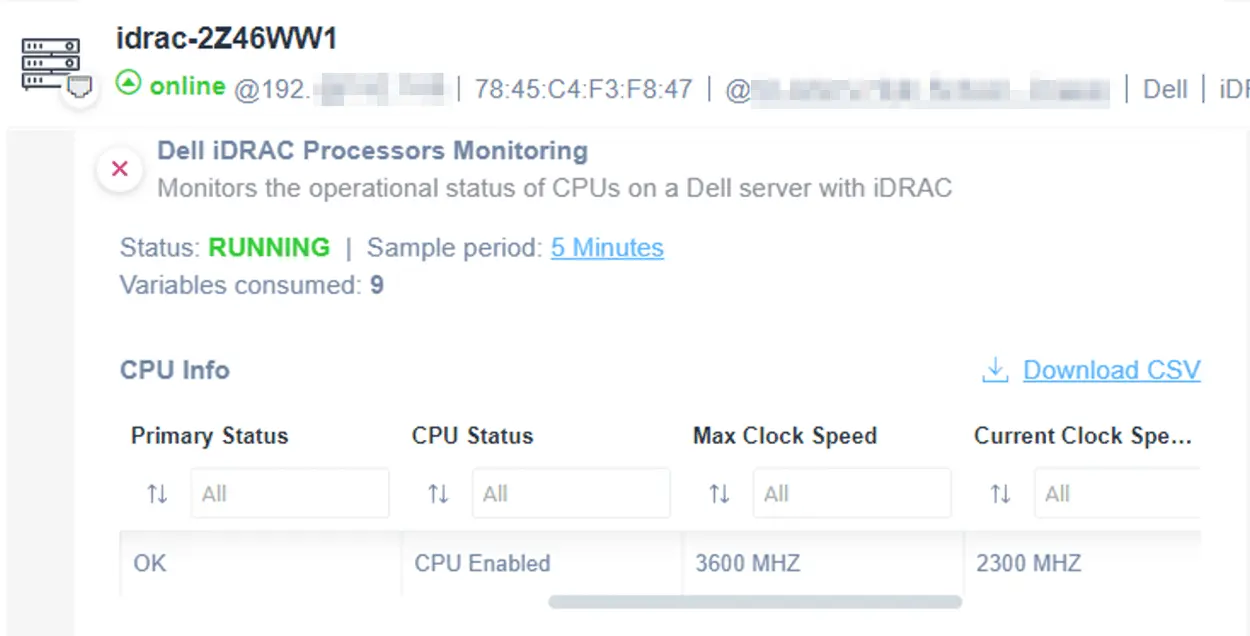
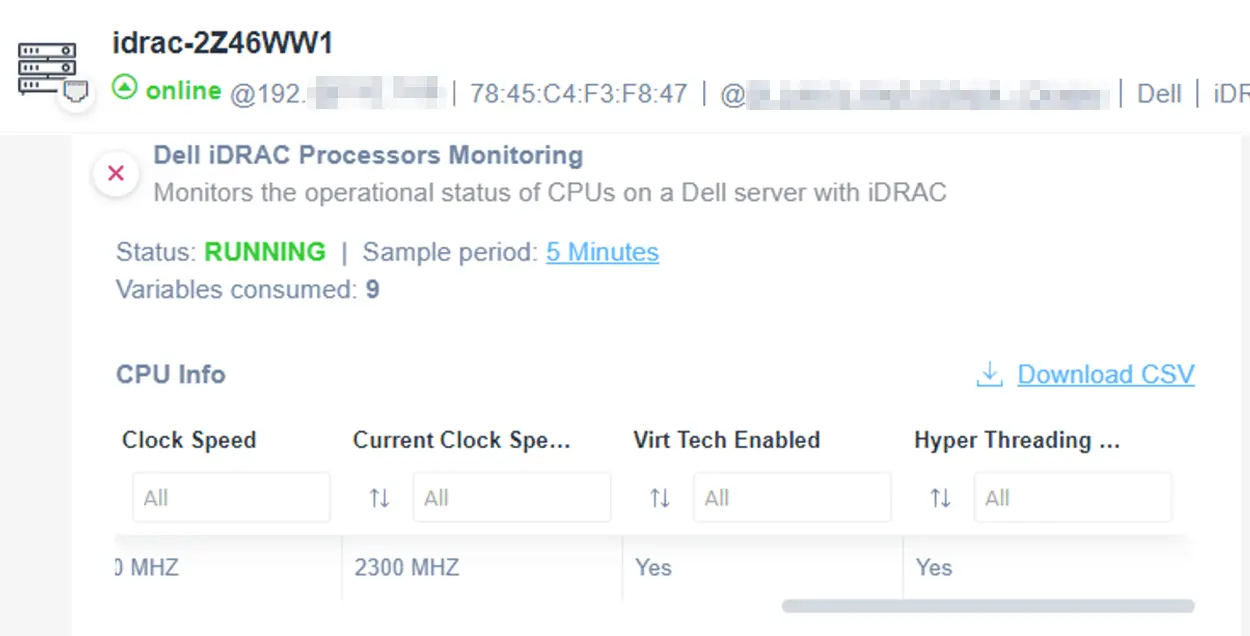
Our specific script about Processors Monitoring will allow you to monitor the following:
- Type
- Description
- Model
- Primary Status
- Max Clock Speed
- Virt Tech Enabled
- Hyper Threading Enabled
Stay updated on the changes to your critical devices. You can also find the Processors Monitoring script on GitHub.
How to Monitor Dell iDrac Components Temperature
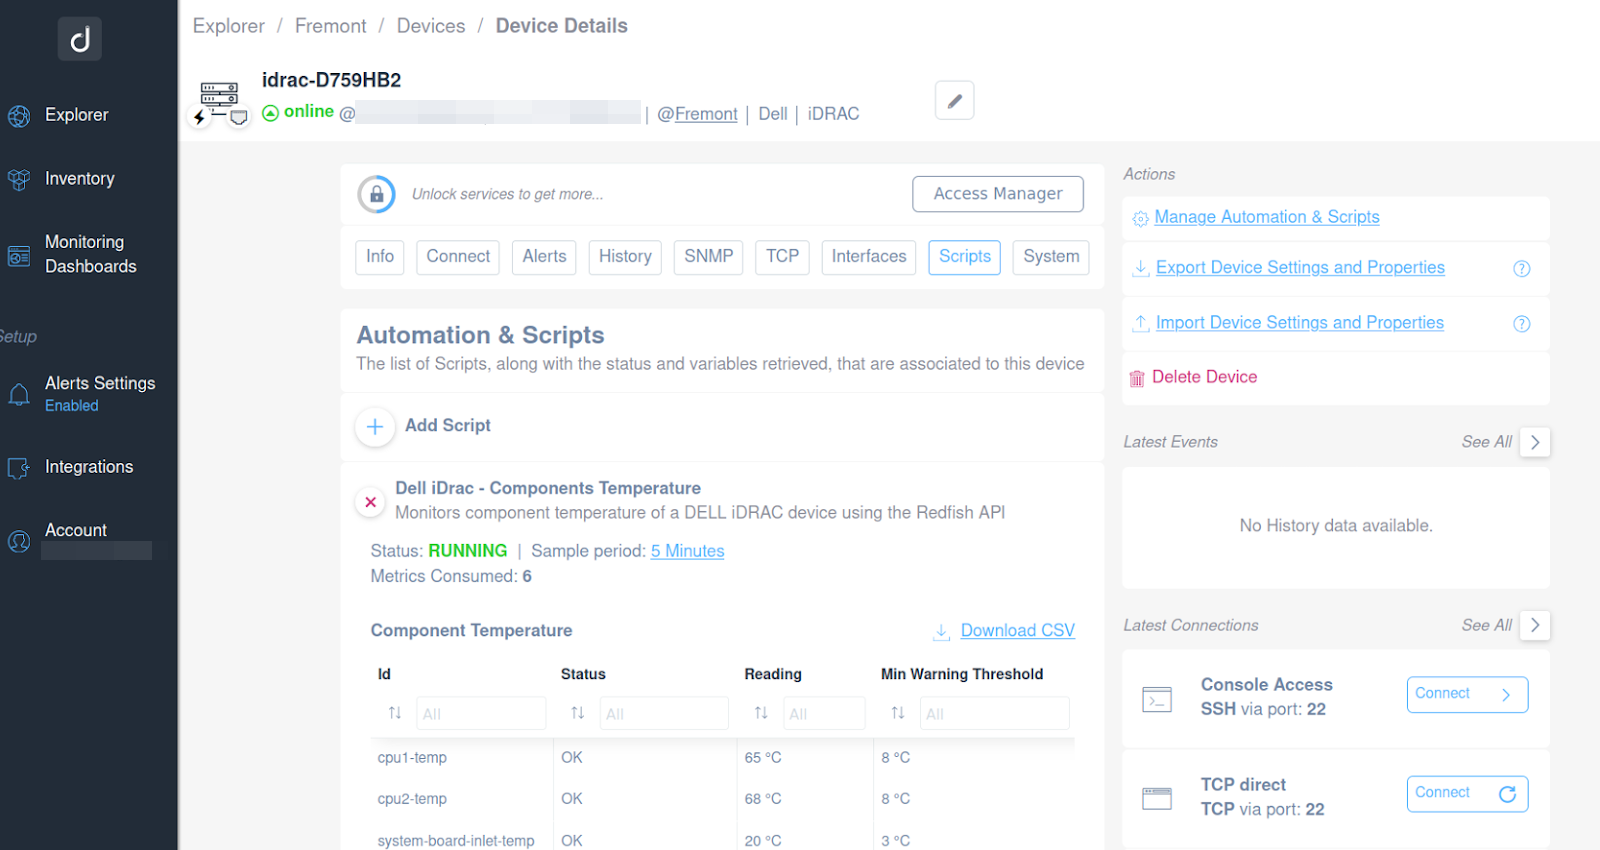
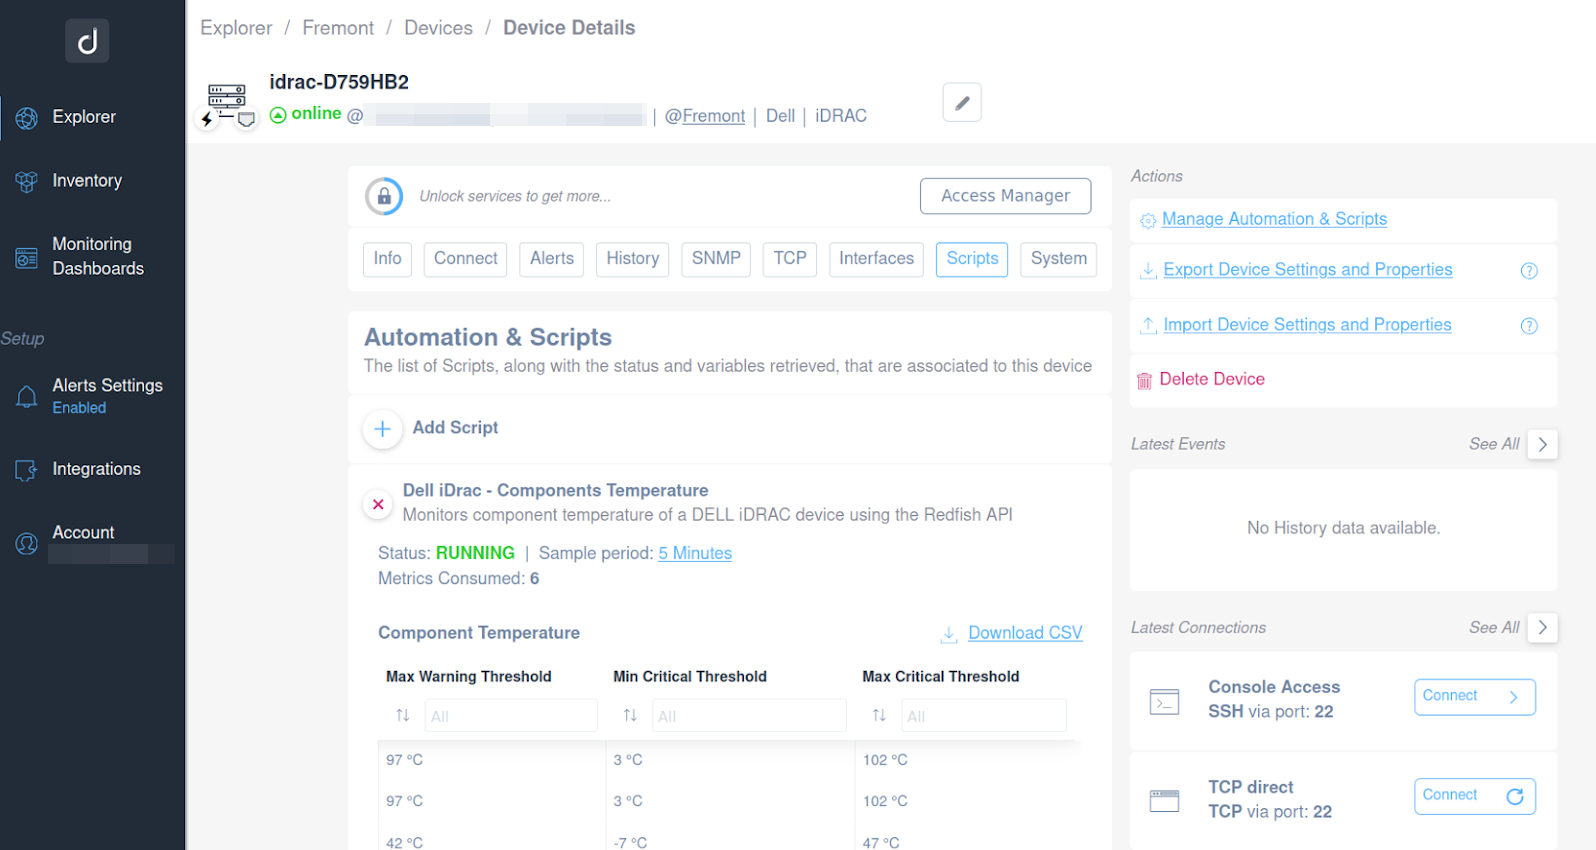
This script can monitor the temperature of various components on a Dell iDRAC server, ensuring that the system does not overheat and operates efficiently.
The script provides component temperature readings so that it is possible to set alerts and be notified if temperatures exceed safe thresholds.
You will be able to monitor the following:
- Status
- Reading
- Min Warning Threshold
- Max Warning Threshold
- Min Critical Threshold
- Max Critical Threshold
The script connects to the Dell iDRAC interface using the Redfish protocol.
How to Monitor Dell iDrac PSU Power Usage
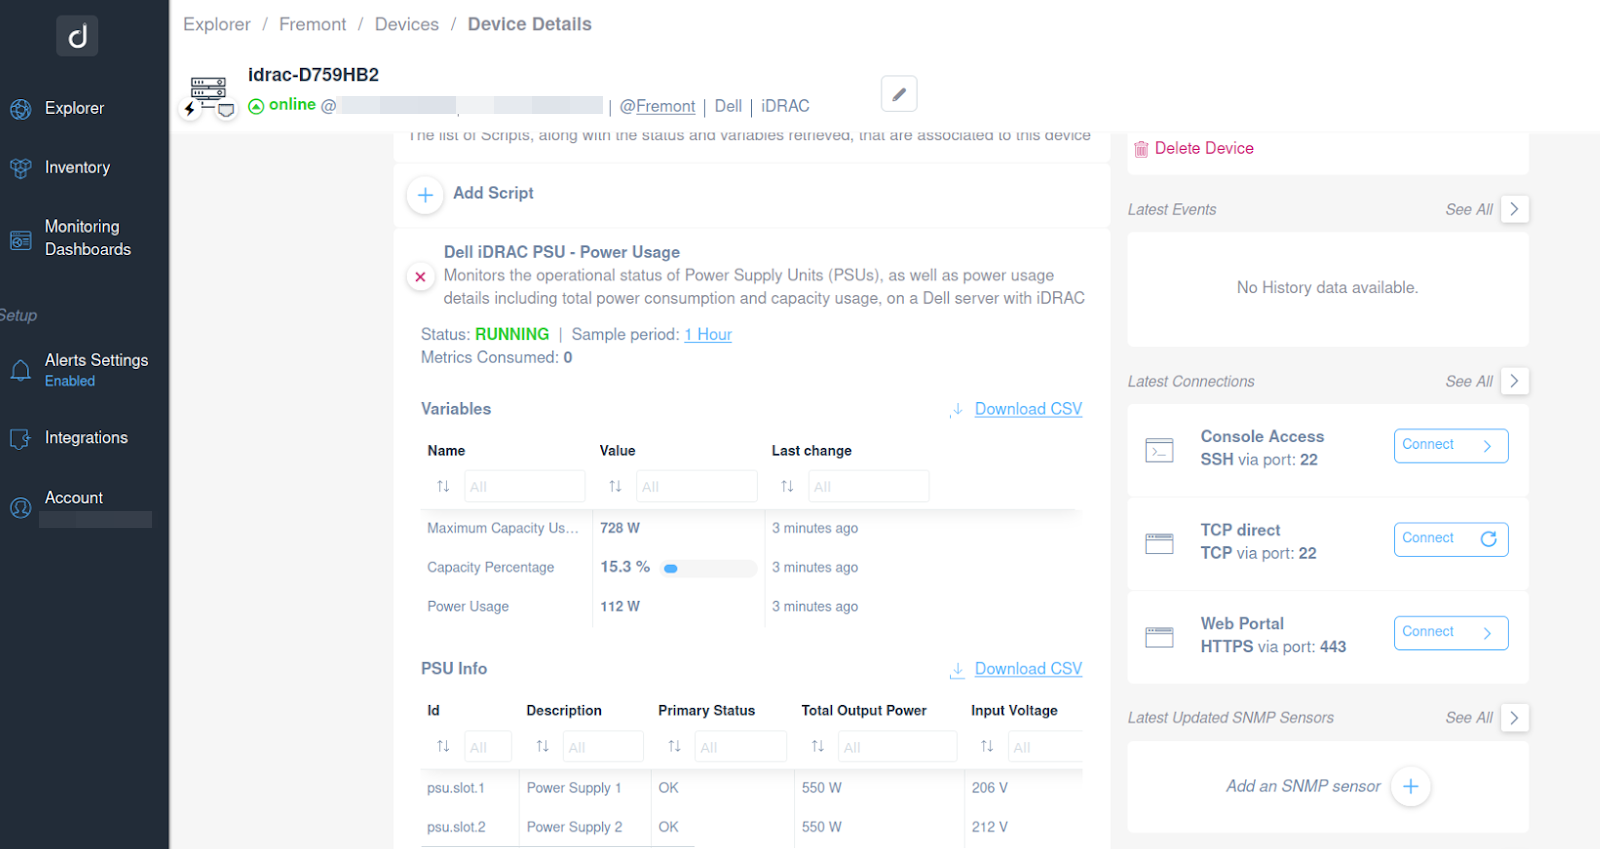
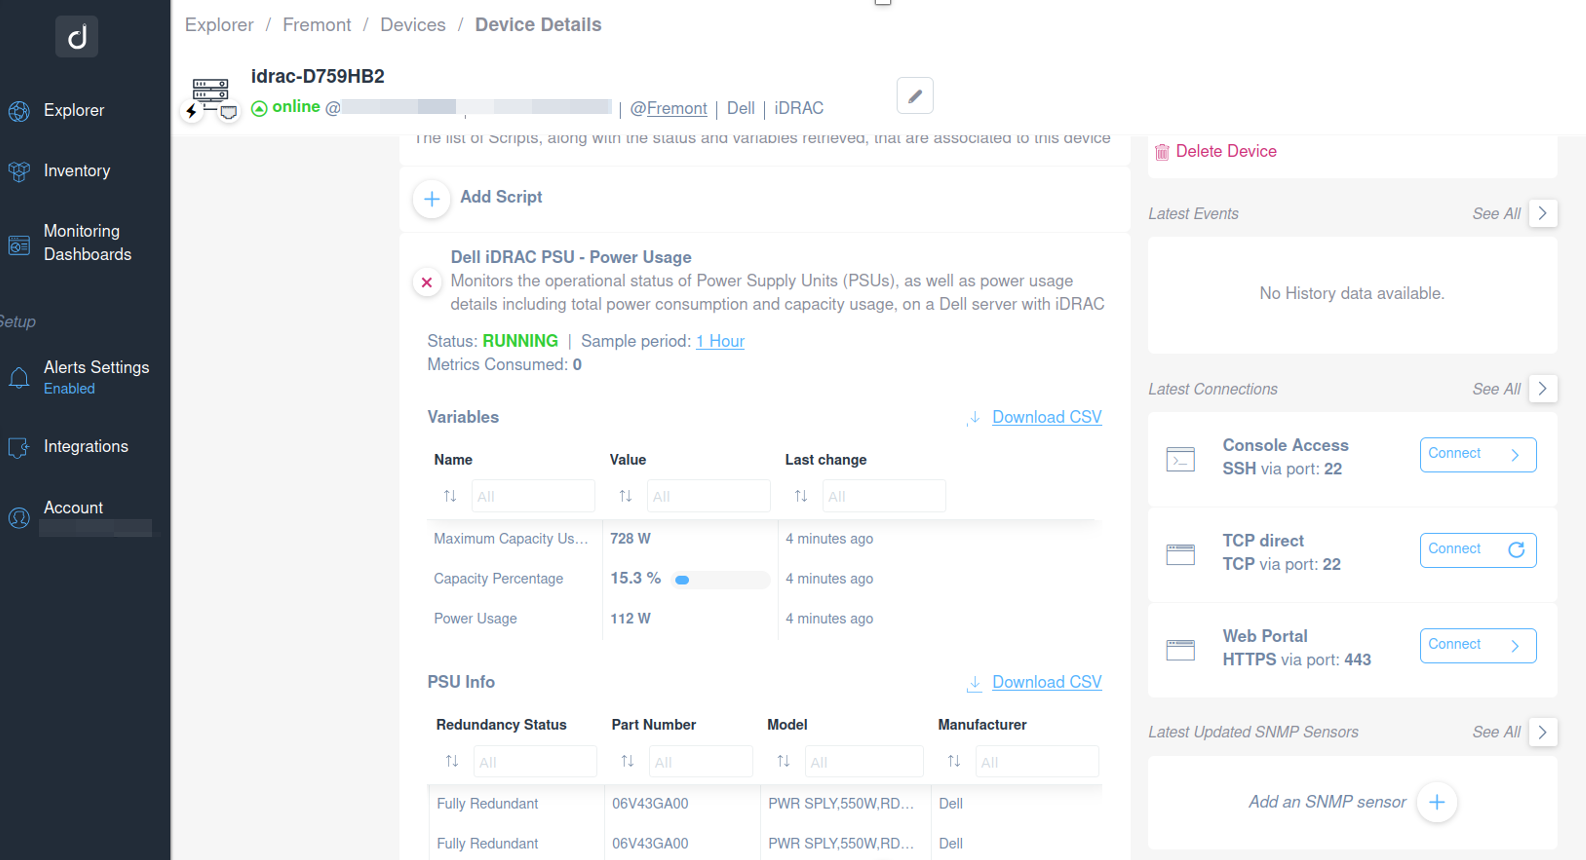
Use this script to monitor the operational status of Power Supply Units (PSUs) and track power usage details, including total power consumption and capacity utilization, on a Dell iDRAC server.
It helps ensure system reliability by providing real-time insights into PSU health, power efficiency, and redundancy status while enabling users to set alerts if power consumption exceeds a predefined threshold.
You will be able to monitor the following:
- Description
- Primary Status
- Total Output Power
- Input Voltage
- Redundancy Status
- Part Number
- Model
- Manufacturer
- Power Usage
- Power Capacity
- Capacity Percentage
The script uses SSH as a communication protocol.
Additional Resources:
Ready to Get Started?
- Uncover Network Blind Spots
- Resolve Issues Faster and Easier
- Exceed Service Delivery Expectations