NAS, Servers, and Workstations Monitoring
Domotz enables users to comprehensively monitor NAS, Servers, and Workstations, offering real-time insights into the health and performance of these critical IT infrastructure components.
To ensure optimal performance and data integrity, we developed robust monitoring features as follows:
- OS Monitoring
- SNMP Server Monitoring
- Custom Scripts Monitoring
From safeguarding data integrity to maximizing server uptime and optimizing workstation productivity, these features will help our users proactively manage and troubleshoot your infrastructure.
Monitoring NAS, Servers, and Workstations has never been more accessible.
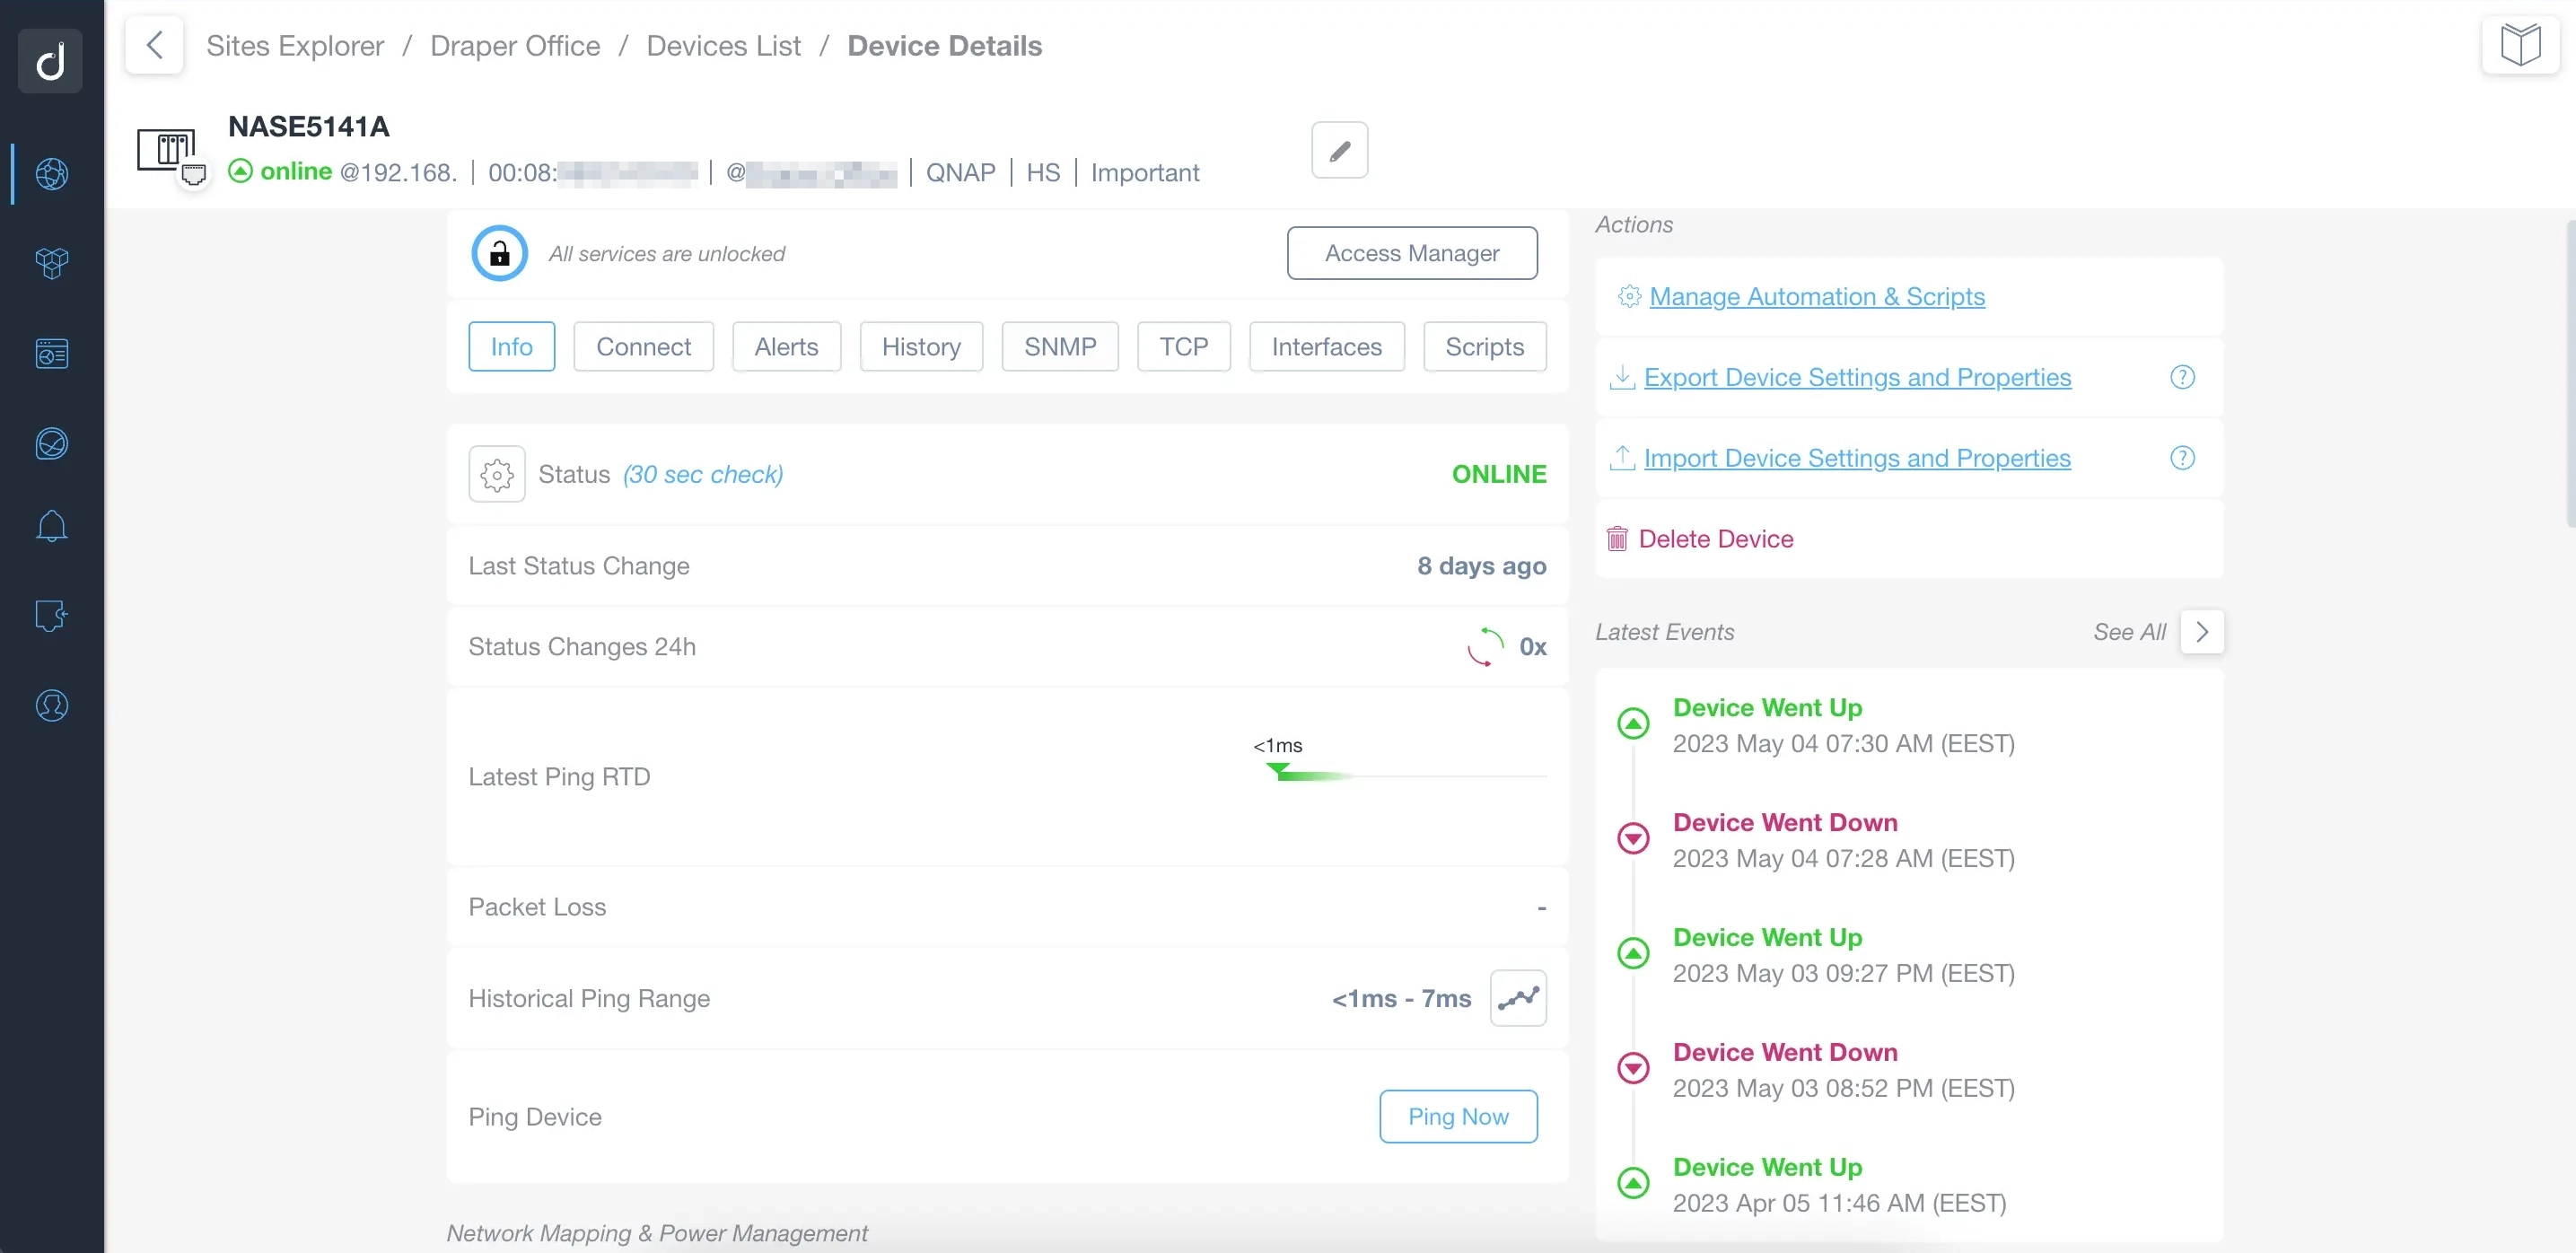
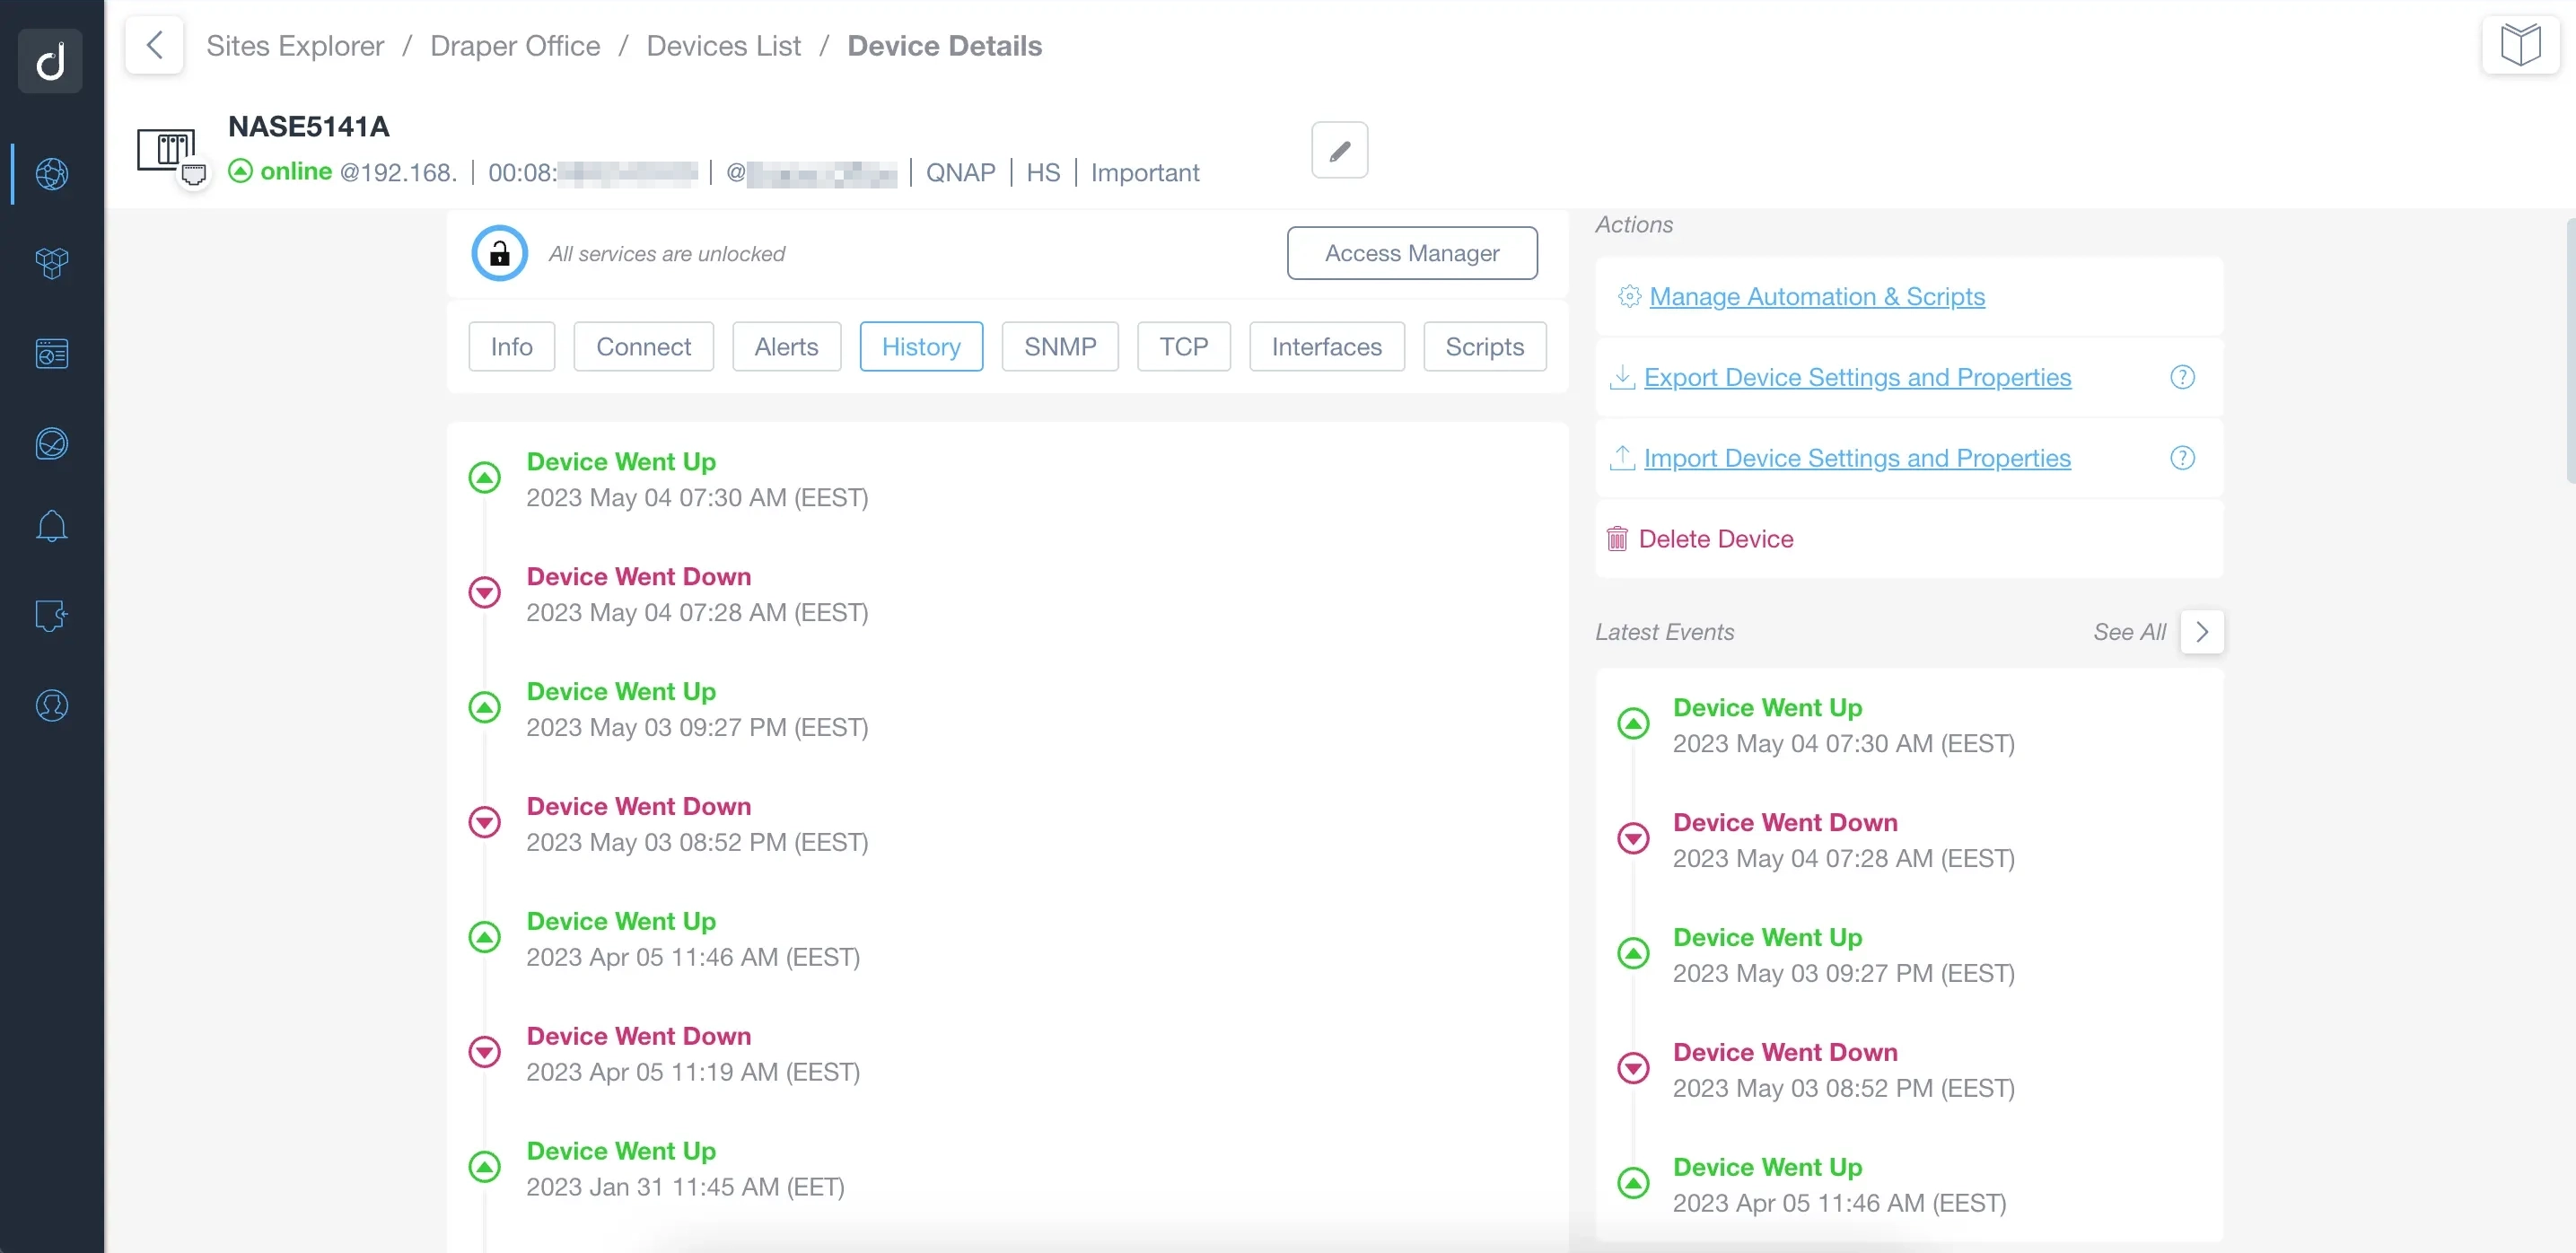
Monitoring NAS
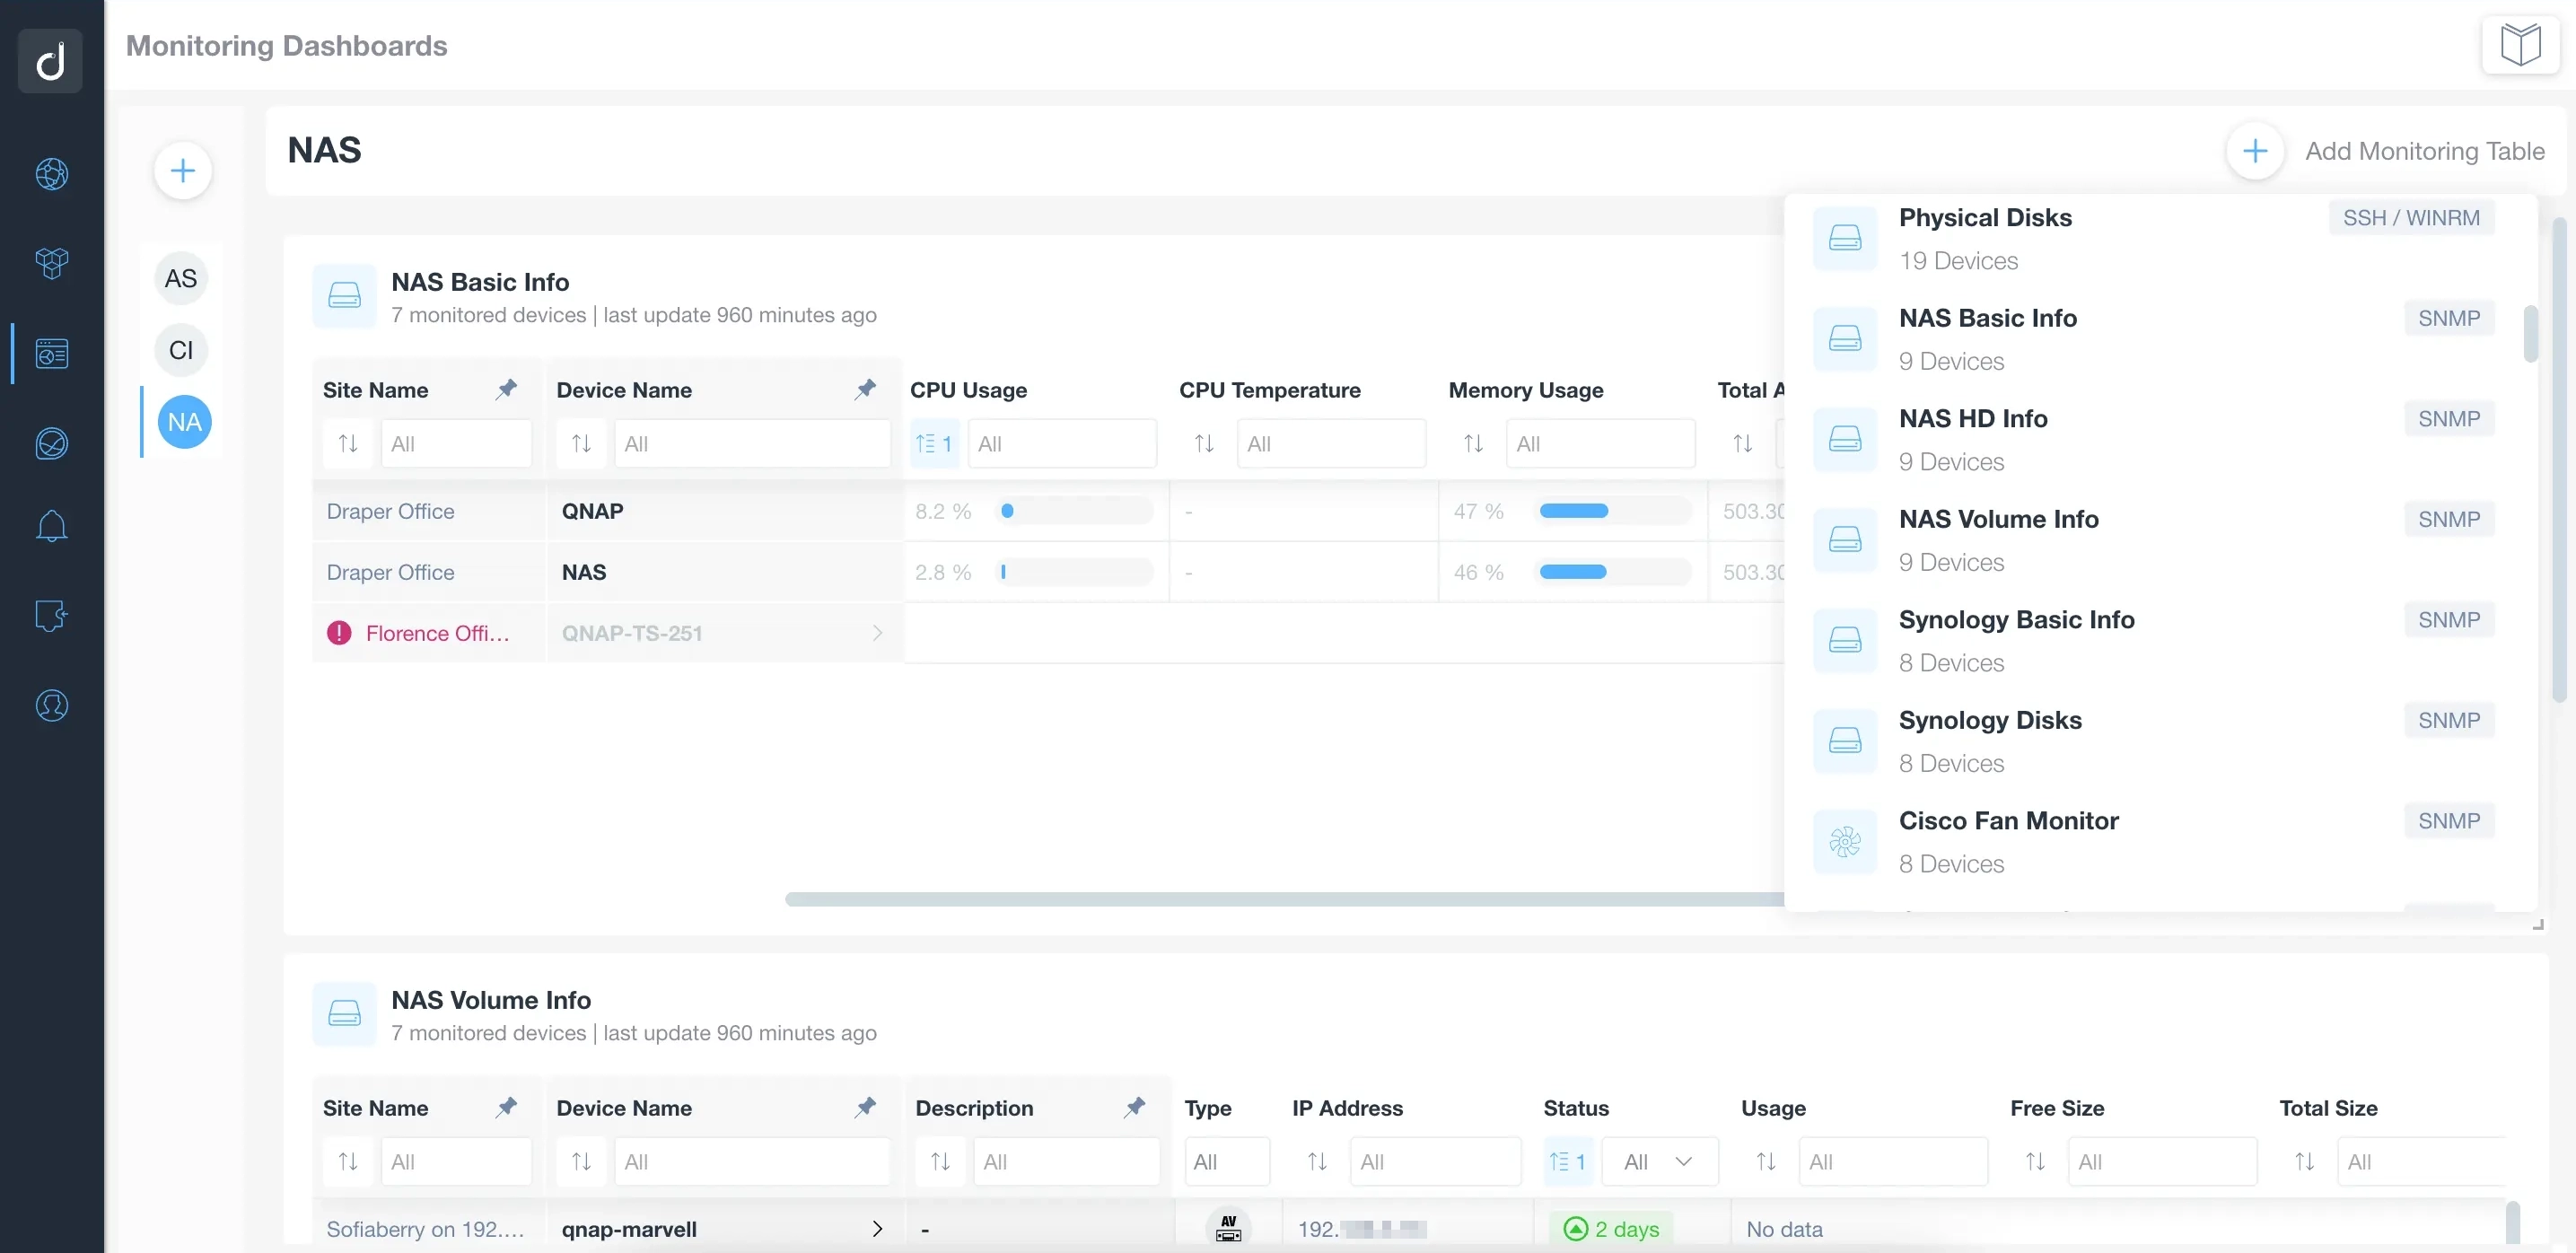
Domotz has built pre-configured SNMP templates to monitor NAS devices.
It will help users monitor various data like the number of hard disks, volumes, CPU or system temperature, and available memory.
You can group all the necessary information in separate views:
- NAS Basic Info Table: will include CPU temperature, CPU usage, total available memory, free memory, system temperature, uptime, number of hard disks, volumes, and last error message
- NAS Hard Disks Table: will include hard disks, status, capacity, info, temperature, and model
- NAS Volumes Table: shows volumes, description, free size, total size, filesystem, and status
- RAID Volumes: include status, usage, and available free storage. In addition, you’ll also get a graphical representation of the historical values for each sensor retrieved
- SMART DISK Status: will monitor the status of the variable and the value for each disk and variable of the disk – for example, airflow temperature, command timeout, pending sector, or power cycle counts
Automatically extract and monitor crucial information via SNMP using pre-configured templates.
Check our complete list of NAS integrations.
Monitoring Servers
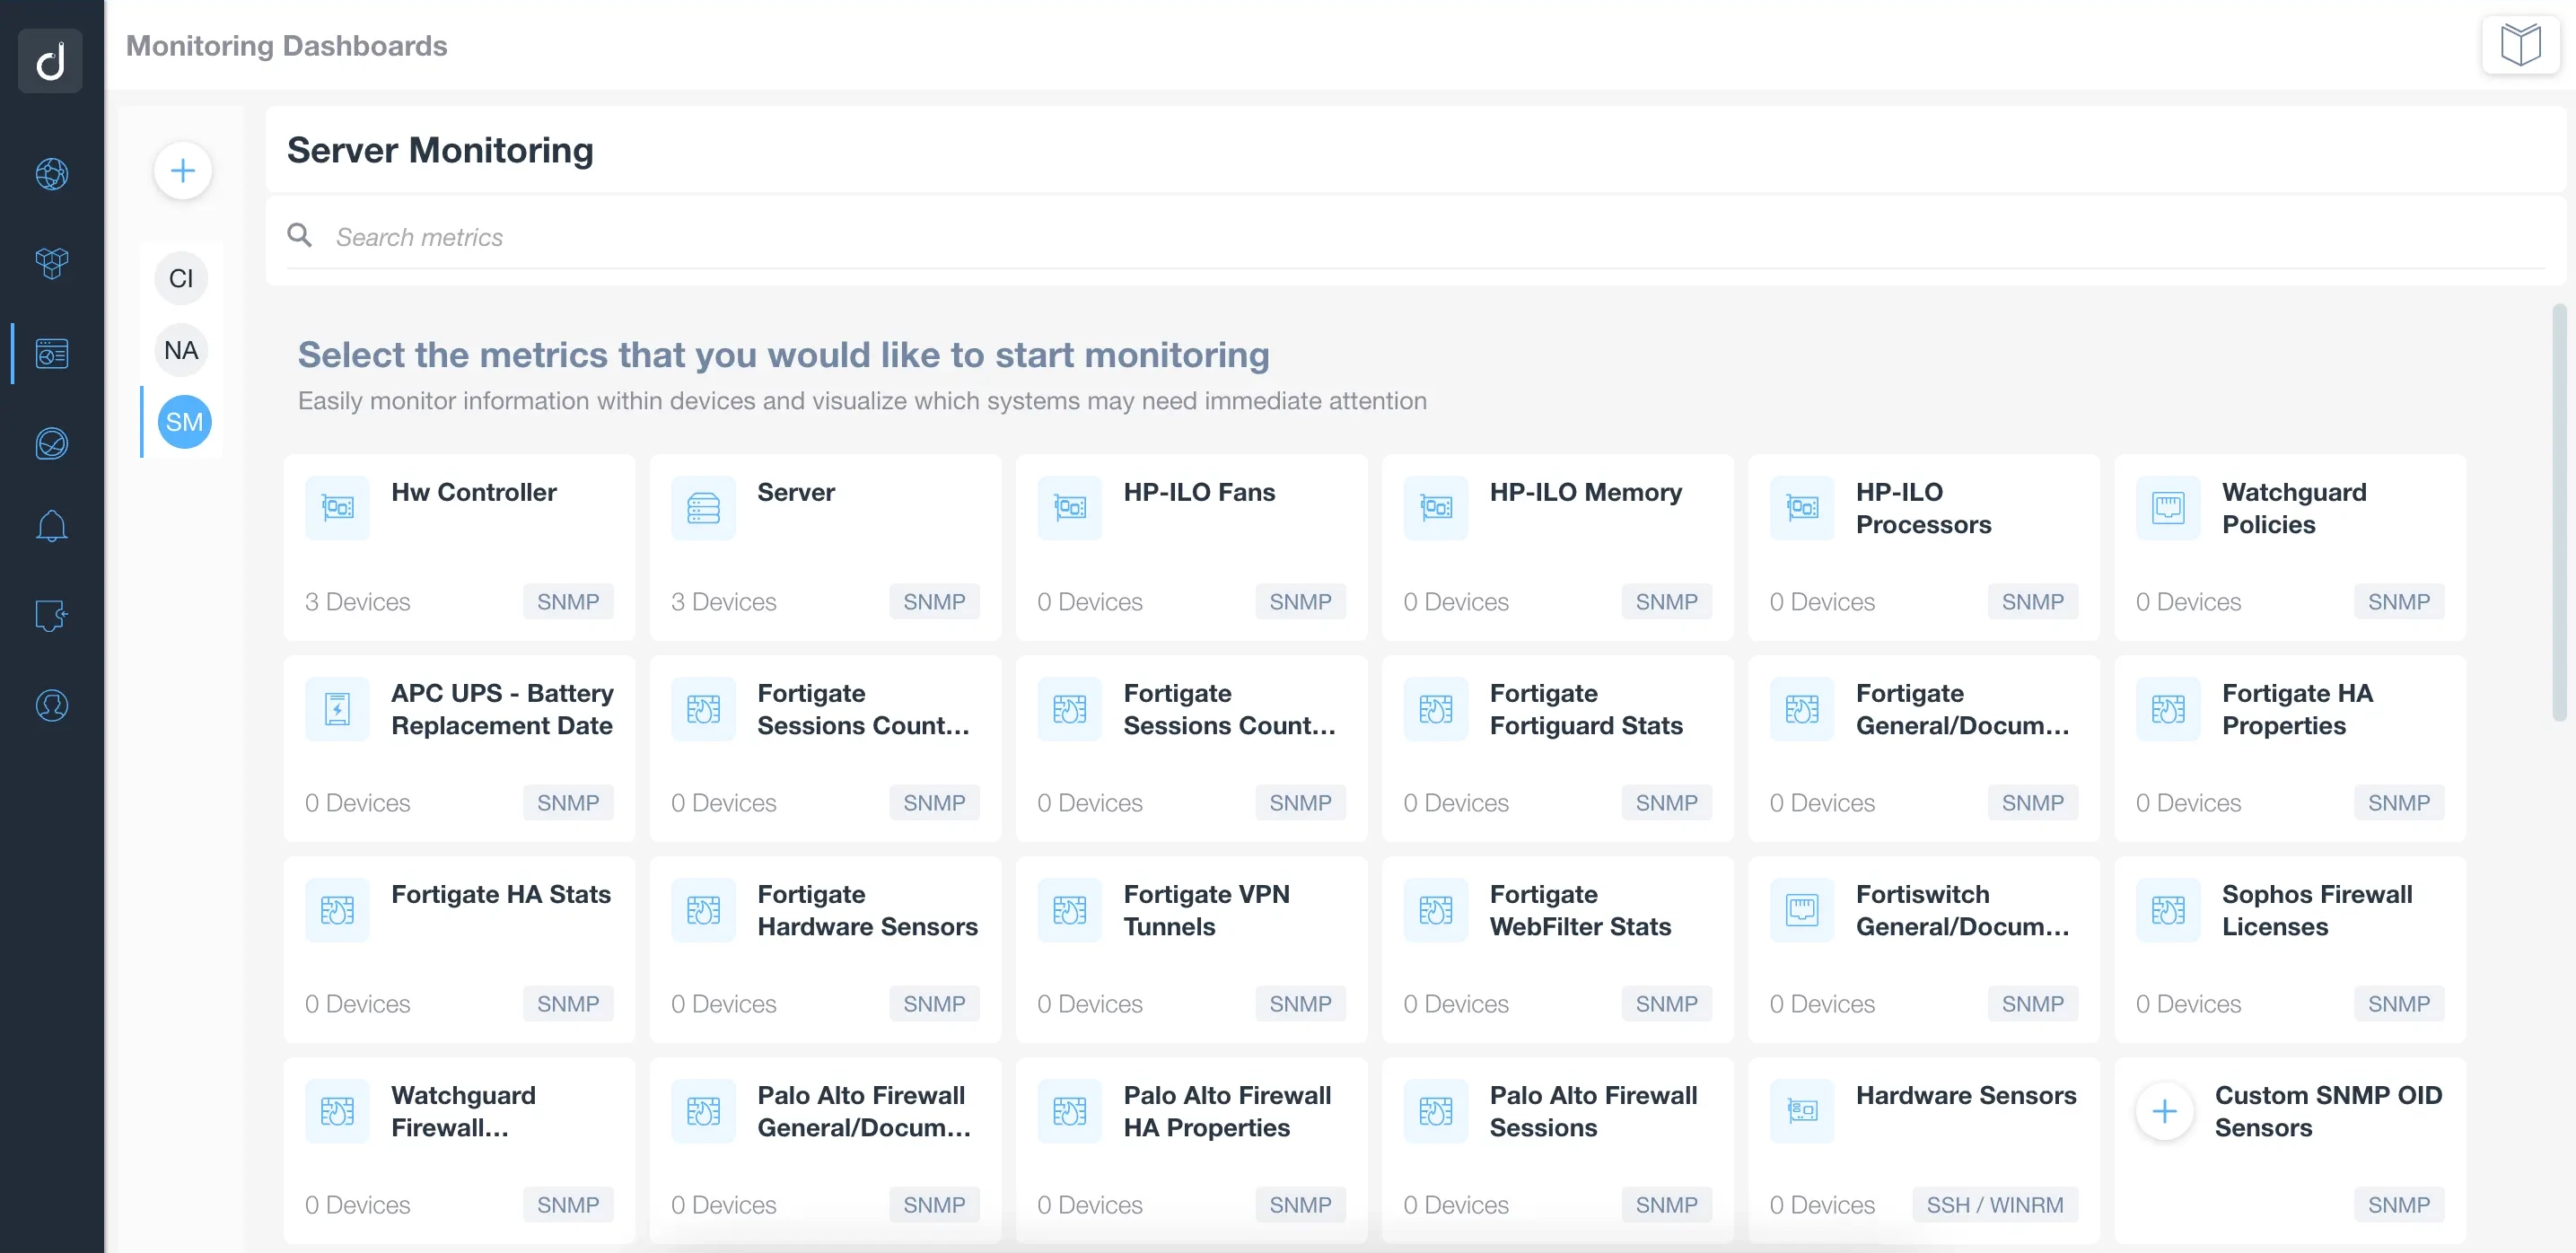
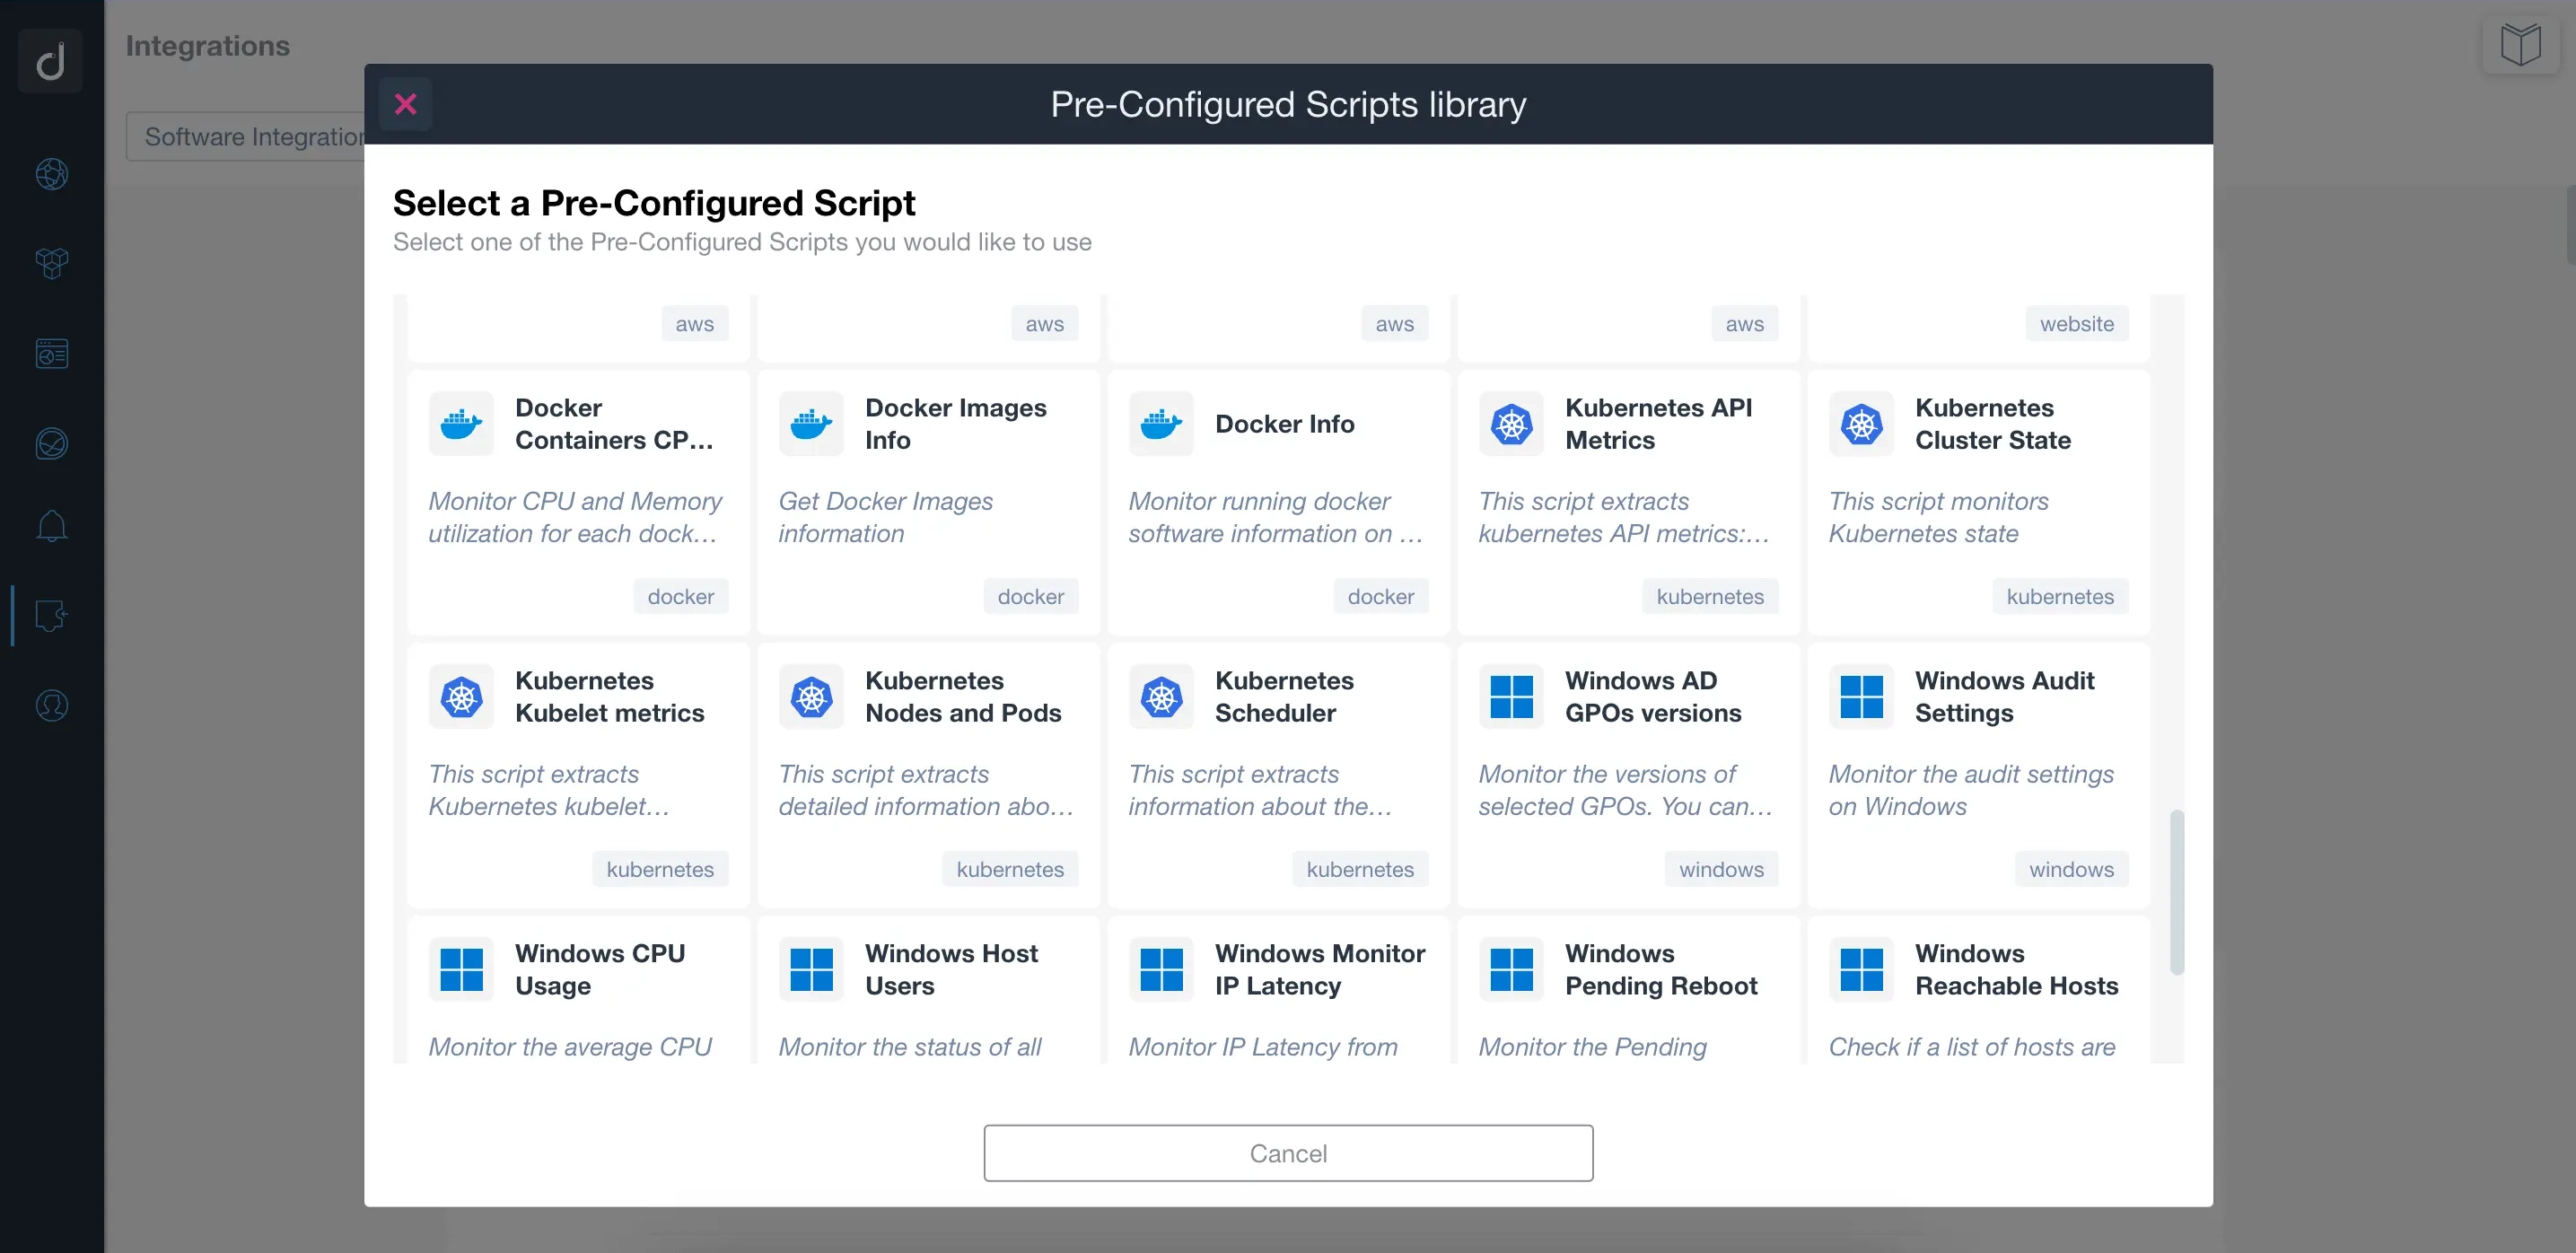
Domotz can help you monitor your servers in different ways.
First, Domotz offers Workstations and Server Inventory to help you extract information about your servers, desktops, laptops, and virtual machines (VM). You can quickly access details such as OS name, version, architecture, serial number, and build number.
Second, Domotz enables TCP service monitoring. You can monitor the TCP port of your services to help you detect when your service is down.
Third, you can monitor your servers using our pre-configured SNMP sensors. For example, you can use them to monitor servers and server controller boards like iDRAC, HPE iLO, Lenovo XClarity, and Supermicro.
Finally, you can add specific custom scripts to monitor various applications through HTTP, SSH, WinRM, Telnet, SNMP, and TCP.
As a result, you can monitor services like Docker, IBM iSeries, Kubernetes, and Windows Active Directory (AD).
Check our full list of Server hardware controllers, Databases and servers, and Server monitoring platforms.
Monitoring Workstations
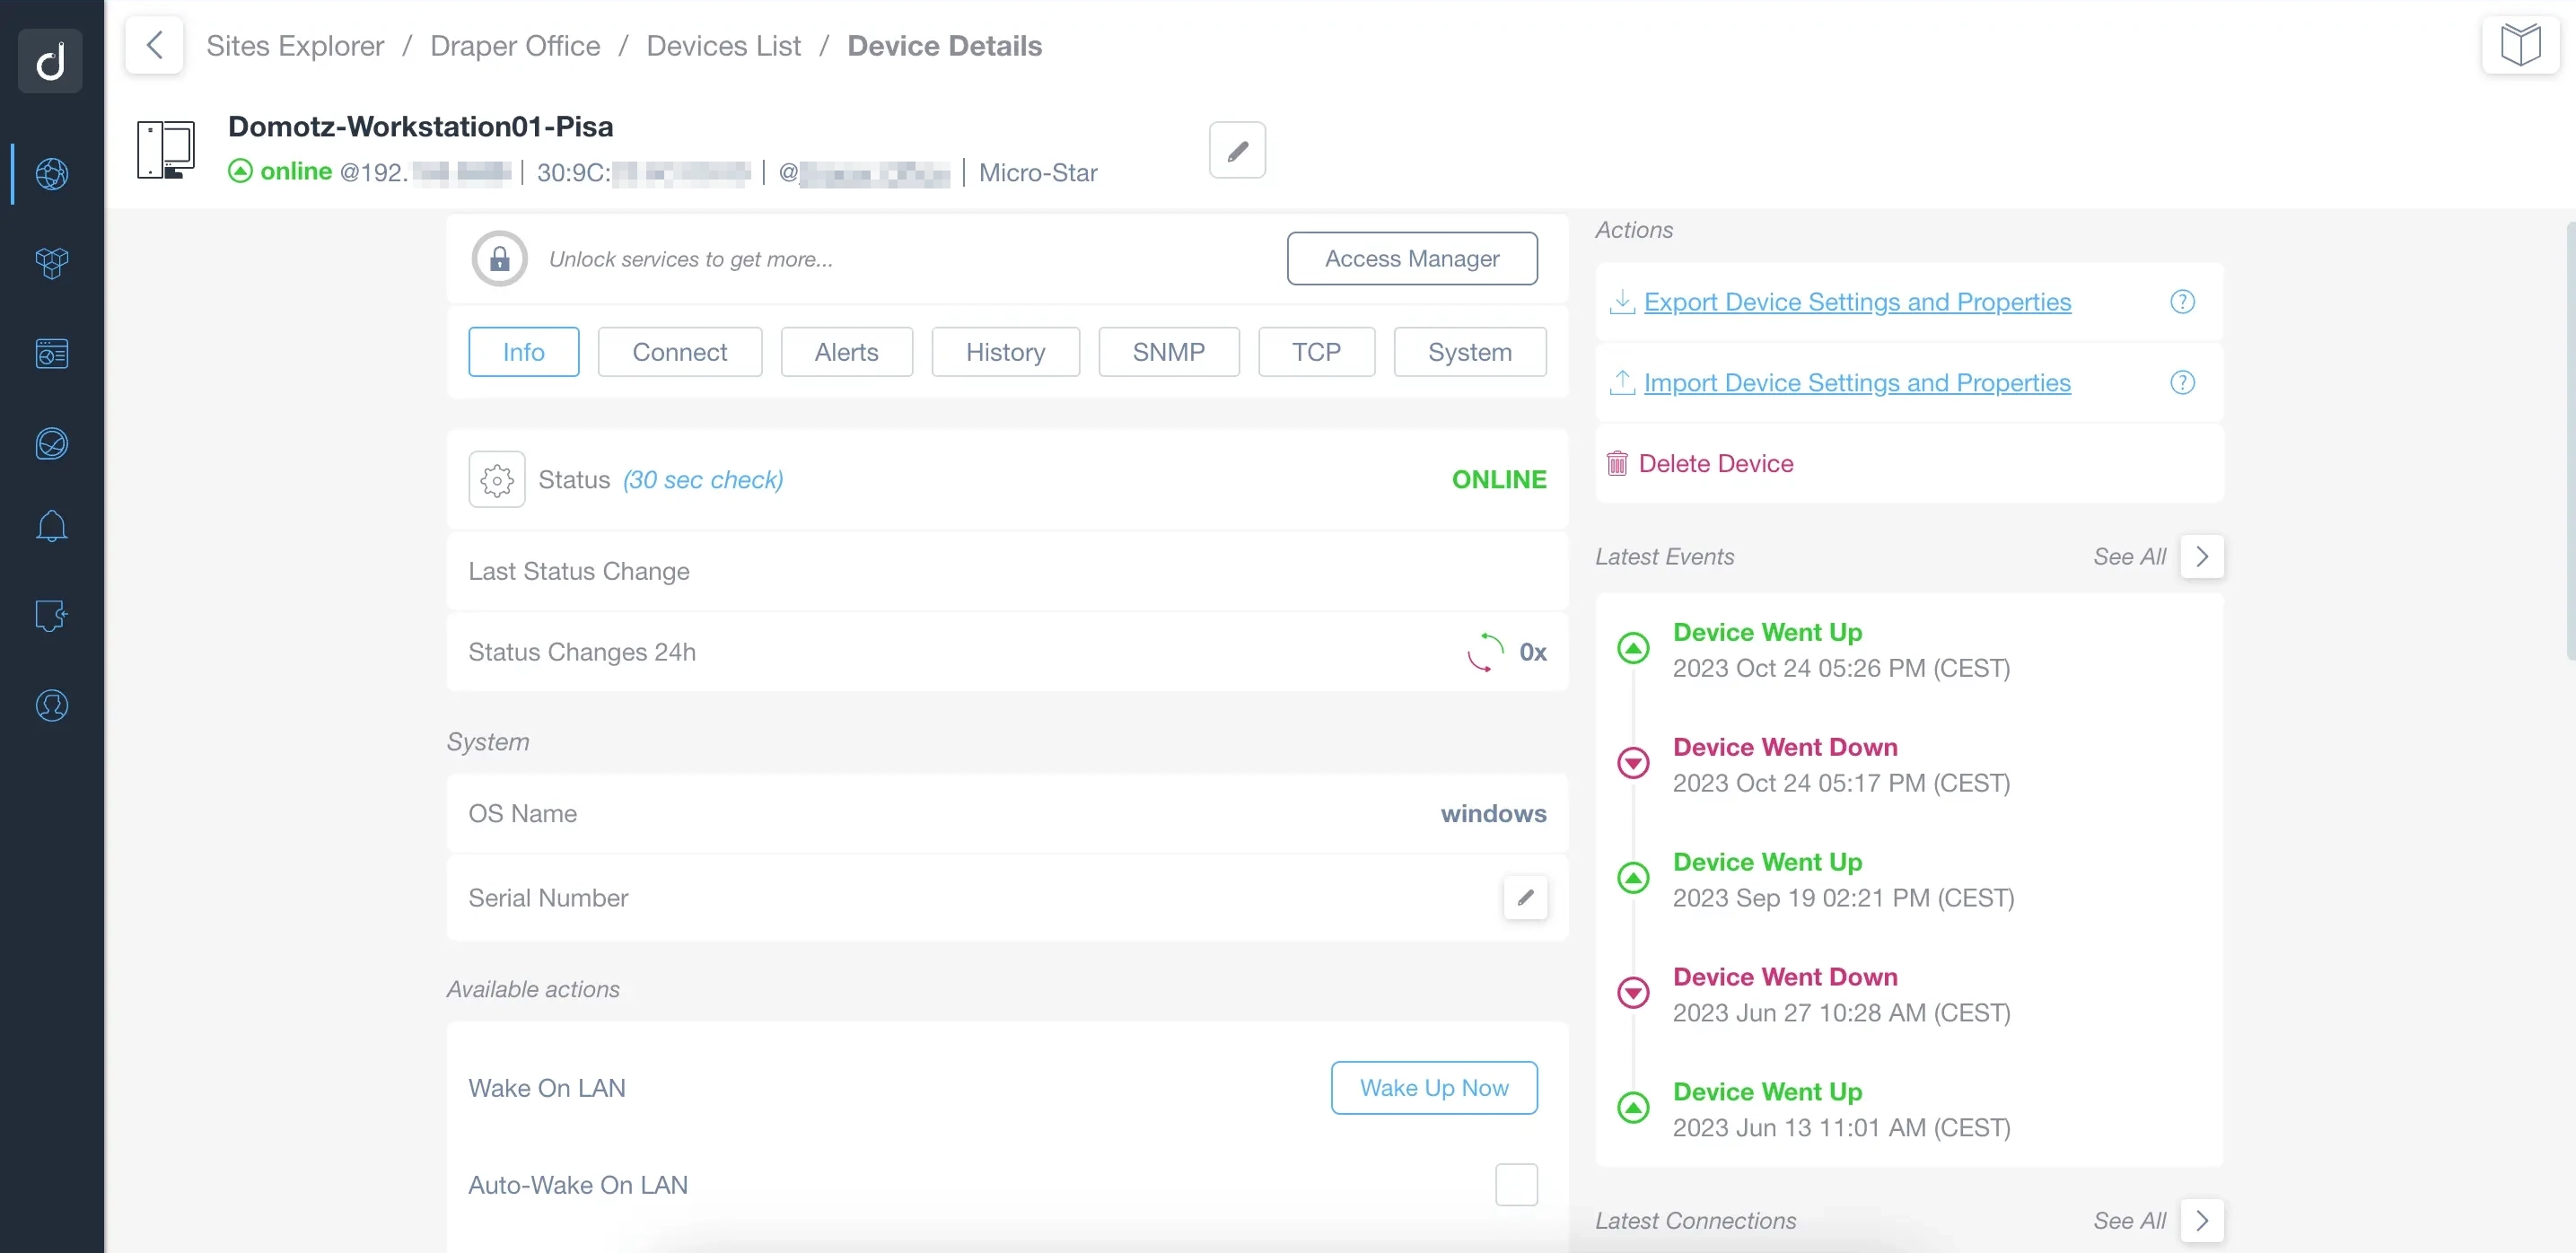
Monitor, manage, and troubleshoot workstations and connected equipment from a centralized dashboard.
Domotz will provide real-time insights into the health and performance of the workstations you monitor, allowing for proactive maintenance and issue resolution.
Using our OS monitoring, you can access advanced information such as OS name, version, vendor, architecture, and serial number.
Additionally, you can add pre-configured SNMP templates to devices you want to monitor. It will help you with tasks such as tracking device uptime, monitoring network traffic, and diagnosing connectivity problems, ultimately improving the efficiency and reliability of workstations and connected systems.
Finally, we’ll provide automated real-time alerts for unusual behavior, ensuring timely responses to potential issues.
Ready to Get Started?
- Uncover Network Blind Spots
- Resolve Issues Faster and Easier
- Exceed Service Delivery Expectations